Denoising sequences to ASVs using DADA2
DADA2 performs quality filtering, denoising, paired-read merging, and chimera removal to produce Amplicon Sequence Variants (ASVs). Unlike OTUs, ASVs represent exact biological sequences with single-nucleotide resolution.
QIIME 2 2026.1
This page targets the QIIME 2 2026.1 amplicon distribution. The qiime dada2 denoise-paired action accepts a --p-pooling-method parameter (default independent, set to pseudo if you want shared error-model information across samples to recover rare features), and supports --p-allow-one-off for higher chimera-removal sensitivity. We use the defaults below; flip those parameters if your dataset has many low-abundance taxa you suspect are being dropped.
Truncation Lengths
The --p-trunc-len-f and --p-trunc-len-r parameters trim forward and reverse reads to a fixed length. Choose these values based on where quality scores drop in your demux summarize visualizations. Here we use 150 bp for both.
Now, we will denoise using DADA2 to generate our amplicon sequence variants. These 'ASVs' represent the 'features' in the resulting feature and representative sequences table.
Recall that denoising does three important things:
- Quality filtering: trims off low-quality reads at a designated location on the sequence.
- Chimera checking: Chimeric reads are generally considered artifacts in sequencing applications (i.e. amplicon sequencing) and need to filtered out from the data during processing. Chimeras occur when two DNA sequences join together. This is a contaminate and if they are not removed, can lead to the user falsely interpreting the sequence as a novel organism.
- Paired- end read joining: Here, we have paired-end data, but each read is sequenced on its own (leading to the production of a "forward" and "reverse" read). We need to join these reads together, so that the overlapping region between them can also be used for correcting sequencing errors and potentially yield sequences of higher quality for better taxonomic annotation. Before joining, trimming low quality bases is necessary for optimizing taxonomy annotation and sequence clustering.
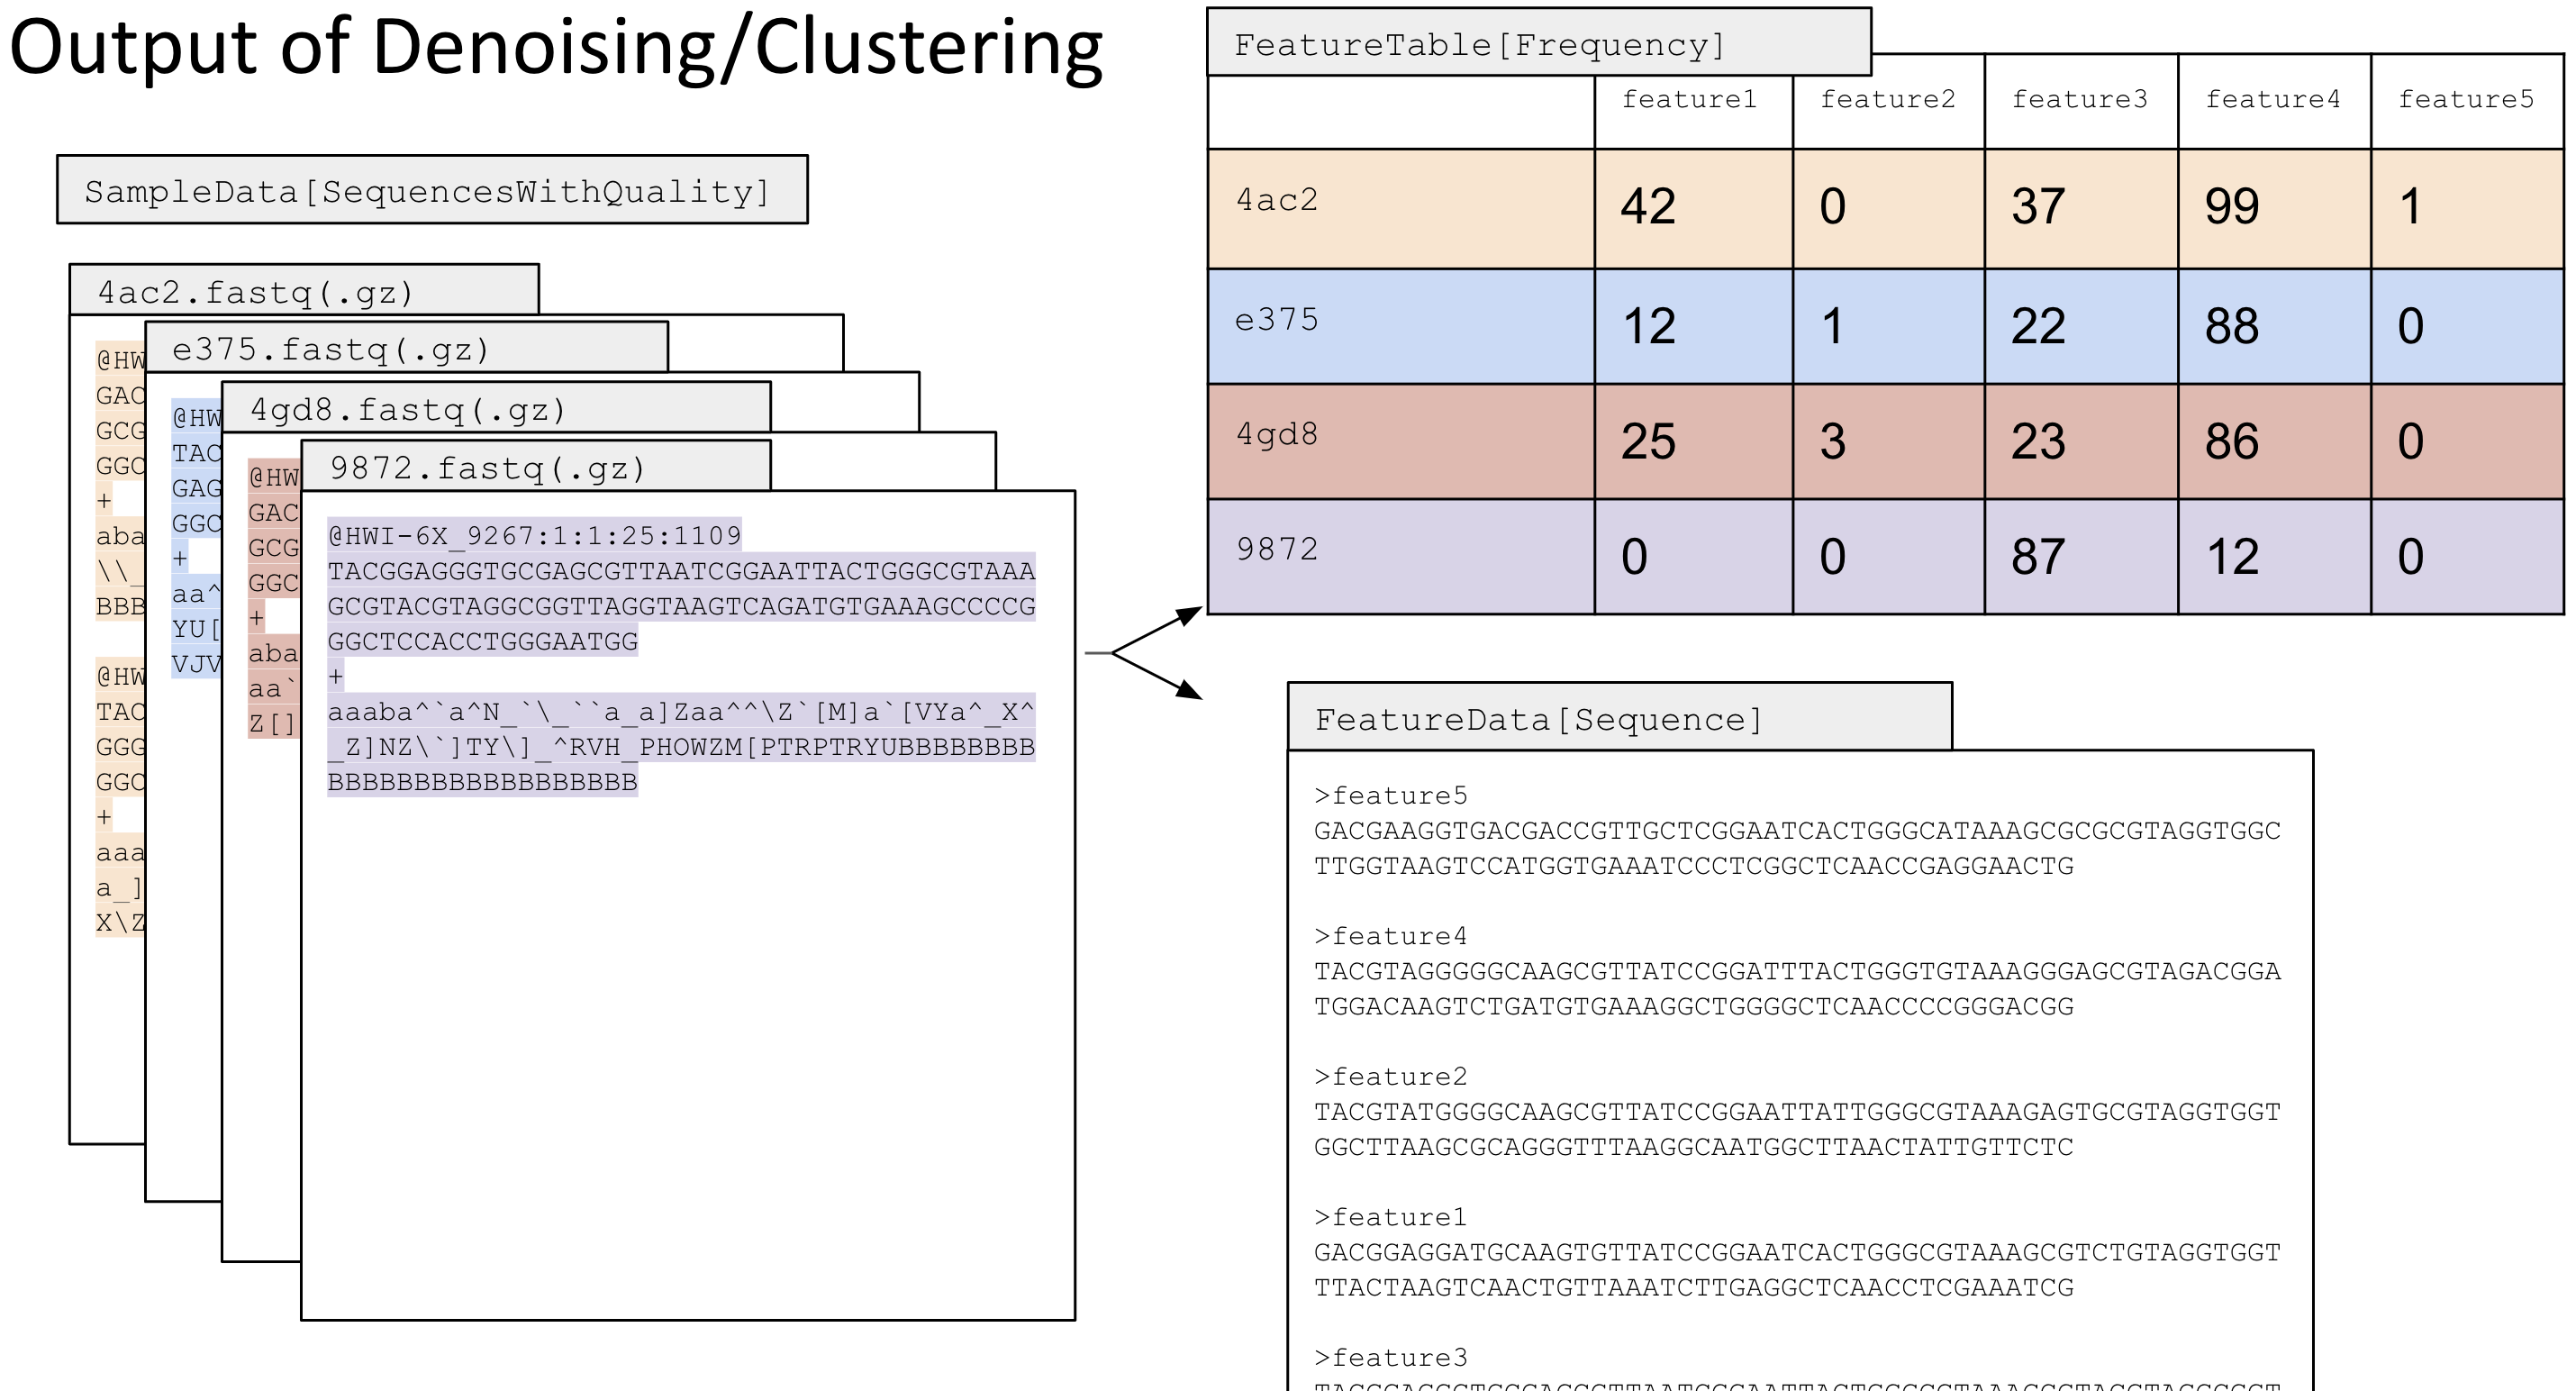
Because we have two sequencing runs, we have to do this twice. You must denoise each sequencing run separately becuase the dada2 model will learn the error from each sequencing run and builds its model off per-sequencing run noise to correct sequences
Denoise Run 2
#denoise for run 2
qiime dada2 denoise-paired \
--i-demultiplexed-seqs ../demux/demux_run2.qza \
--p-trunc-len-f 150 \
--p-trunc-len-r 150 \
--p-n-threads 6 \
--o-table table_run2.qza \
--o-representative-sequences seqs_run2.qza \
--o-denoising-stats dada2_stats_run2.qza \
--o-base-transition-stats base-transition-stats_run2.qza
DADA2 denoising creates four output files:
-
a denoising stats file (e.g. stats.qza), to see how well denoising performed
-
a feature table (e.g. table.qza), a table with your ASVs (features) and their abundance
-
a representative sequences file (e.g. seqs.qza), a list of your ASVs and their DNA sequence
-
a base transitions stats file (e.g. base-transition-stats.qza), a way to check how well dada2 is correcting errors
Review the denoising statistics for run 2:
- You should still be in the dada2 directory use
pwdto check.
qiime metadata tabulate \
--m-input-file dada2_stats_run2.qza \
--o-visualization dada2_stats_run2.qzv
Interpreting Denoising Stats
The stats table shows how many reads passed each step (filtering, merging, chimera removal). A typical run retains 60–80% of input reads. If you are losing many reads at the merging step, your truncation lengths may be too short to allow forward and reverse reads to overlap. If you are losing too many reads at the filtering step, this could indicate your primers are still in the sequences. this is a very important quality control step to check before you move further in your analysis!
Check off each item as you review the stats for both runs:
Denoise Run 3
- You should still be in the dada2 directory use
pwdto check.
demux_run3.qzv in QIIME2 View. The truncation lengths may differ from run 2 if the quality profiles differ, but for this workshop both runs use 150 bp.
--p-trunc-len-f, Forward read truncation length (integer bp).--p-trunc-len-r, Reverse read truncation length (integer bp). Must be long enough that forward and reverse reads still overlap after truncation.
Review the denoising statistics for run 3:
qiime metadata tabulate \
--m-input-file dada2_stats_run3.qza \
--o-visualization dada2_stats_run3.qzv
DADA2 stats file interpretation guidlines:
Each row is a sample.
Columns:
-
Input: number of reads per sample (same number as in the demux.qzv)
-
Filtered: number of reads that passed dada2 filtering
-
% of input passed filter: % of reads that passed dada2 filtering
-
Denoised: number of reads kept after denoising
-
Merged (only when using paired end data: number of reads merged)
-
Non-chimeric: number of reads that are non-chimeric (recall that a chimera is a PCR artifact that is created when two different reads are combined together).
-
% of input non-chimeric: % of reads that are non-chimeric
On this visualization, you are checking to see if there are any samples where a large portion of the reads are removed. Having a few samples like this is ok, but if all of your samples have a large portion of reads removed, then there may be an issue with your data.
You will have a set of files for each denoising command (e.g., one set for run 2 and one set for run 3, so six files total).
You might notice the --p-trunc-len line, and may be wondering what the 150 means. If you remember when we looked at demux_seqs.qzv in QIIME2 View, the interactive quality plot showed that these data were pretty good quality. So, we decided to keep the whole length (150 base pairs) of all reads. In practice, if you start to see the quality dip below 30, you may want to decide to trim some of those low quality base calls off, that way you can be confident in any later analyses. If you were to see quality dip at the beginning of the sequence (usually due to sequencing chemistry), or if you need to trim off your barcodes, you can use --p-trim-left to do this.
Important notes about denoising:
1. Here, we have 2 sequencing runs, this happened because we had so many samples that it needed to be spread out over multiple runs. in this case its important to randomize across runs to account for batch affects. so in order to get all samples we need for the subset we chose for the tutorial data, we needed to uses runs "two and three". thats why we have to do some steps twice. after we denoise, we can then merge the sequences and table into singular files for the rest of the analysis.
2. When you merge two runs together, you MUST use the same trim and truncate parameters or they wont merge properly.
Merge denoised feature table for runs 2 and 3
Merge denoised tables - required when you have samples from multiple sequencing runs like we have here. Then visualize the merged table so all samples are in one place.
qiime feature-table merge \
--i-tables table_run2.qza \
--i-tables table_run3.qza \
--o-merged-table table.qza
qiime feature-table summarize \
--i-table table.qza \
--o-feature-frequencies feature-frequencies.qza \
--o-sample-frequencies sample-frequencies.qza \
--o-summary table_dada2_visual_summary.qzv
The table file contains the following:
Features = ASVs
Overview tab: this tab gives you an overview of the summary statistics.
-
Table summary: # of samples, number of total features (ASVs) in the dataset, and total feature frequency (how many times were the features observed across all samples?).
-
Frequency per sample: stats on reads per sample. Ex: on average, the frequency of features observed in a sample ~4,000.
-
Frequency per feature: stats on how much a feature/ASV shows up. Ex: on average a feature is observed 683 times.
Interactive Sample Detail tab
-
Plot: This is a summary of how many individual samples are present in each of our metadata groups. If we stay on the barcodes metadata category, it makes sense that there would be one sample per barcode. This isn’t super interesting, so change to the metadata you care about (sample type or facility). How many samples are in each group?
-
Table: this is the table that describes the seequencing depth in each sample (in decreasing order). This is now where we can determine an even sampling depth for rarefaction (a later topic). Rarefaction is necessary to normalize our data to an even sampling depth due to the uneven nature of sampling in our sequencing efforts.
-
Open the
table_dada2_visual_summary.qzvfile Looking at the sampling depth, you can use the bar to determine what your filtering should be set at. As you move the sampling depth bar, you will see that the seq depth number will change and in the table below, it will highlight the number of samples excluded (in pink). For example, if you scrolled the bar over to to ~4,000, this will show you the samples lost if you rarefy at 4k reads per sample.- the sentence below that says "Retained 1,100,000 (47.26%) features in 275 (62.08%) samples at the specifed sampling depth" this means you have a TOTAL of ~1.1 million reads (summed across all samples), and 275 samples are retained when you rarfy at that depth.
- looking at this file and the reads associated with each sample is a very important QC steps - mainly to see how much sequencing per sample you got and if any samples failed sequencing.
-
on the Feature Detail page: you can see each ASVs and how many times it was found in your samples, as well as the reads associated with it.
-
Note: downloading your files: As you may notice, having .qzv files might not be the most helpful for external stats/analyses that you might do in excel or R. For .qzv files, you can download straight from the .qzv visualization from qiime2view as shown here!
Merge denoised sequences for runs 2 and 3
qiime feature-table merge-seqs \
--i-data seqs_run2.qza \
--i-data seqs_run3.qza \
--o-merged-data seqs.qza
This file contains the ASV Feature ID and its corresponding sequence. Now you have all the ASVs (without redundant features) for both runs in one place.
This file will list all of the ASVs, the ASV length, and the sequence for that ASV
In your seqs.qzv file, what happens when you click on one of the blue sequences?
Now we have a single table we can use for all the remaining analysis steps.
seqs.qza and table.qza
Outputs
| File | Type | Description |
|---|---|---|
table_run2.qza / table_run3.qza |
Artifact | Per-run ASV feature tables |
seqs_run2.qza / seqs_run3.qza |
Artifact | Per-run representative sequences |
dada2_stats_run2.qzv / dada2_stats_run3.qzv |
Visualization | Denoising statistics |
table.qza |
Artifact | Merged feature table (both runs) |
table.qzv |
Visualization | Summary of merged feature table |
seqs.qza |
Artifact | Merged representative sequences |
seqs.qzv |
Visualization | Summary of merged sequences |
This completes Day 1. Continue to Day 2, Community & Advanced Analyses.