Importing Demultiplexed Sequences
Importing Data
Before we can analyze sequencing data in QIIME2, we first need to import it. This step tells QIIME2 where your data lives and how they are formatted.
There are two common ways to import data into QIIME 2, you will get practice with both:
Using a manifest file – QIIME2 works with its own artifact format (.qza), so the first step is to import your demultiplexed FASTQ files using a manifest file, a text file that lists each sample and the path to its corresponding sequencing files. This is the approach you will use for the decomposition dataset because the sequences have already been demultiplexed.
Using compressed raw sequencing files – This method is typically used when you receive raw data directly from a sequencing facility. This is the approach we will use for the homework.
QIIME2 works with its own artifact format (.qza). The first step is importing your demultiplexed FASTQ files into this format using a manifest file that maps sample IDs to file paths.
Demultiplexing
Let's review demultiplexing. Remember that after extracting the DNA, we can use a barcoded PCR technique to assign a unique 12 base-pair barcode to all of the sequences within a single sample. After pooling and sequencing everything in one sequencing run (multiplexing; makes sequencing cheaper!), we can bioinformatically demultiplex to separate the sequences based on the sample they came from using the 12 base pair (bp) barcode.
Simply put, demultiplexing means we take the sequences and assign to them to the appropriate samples
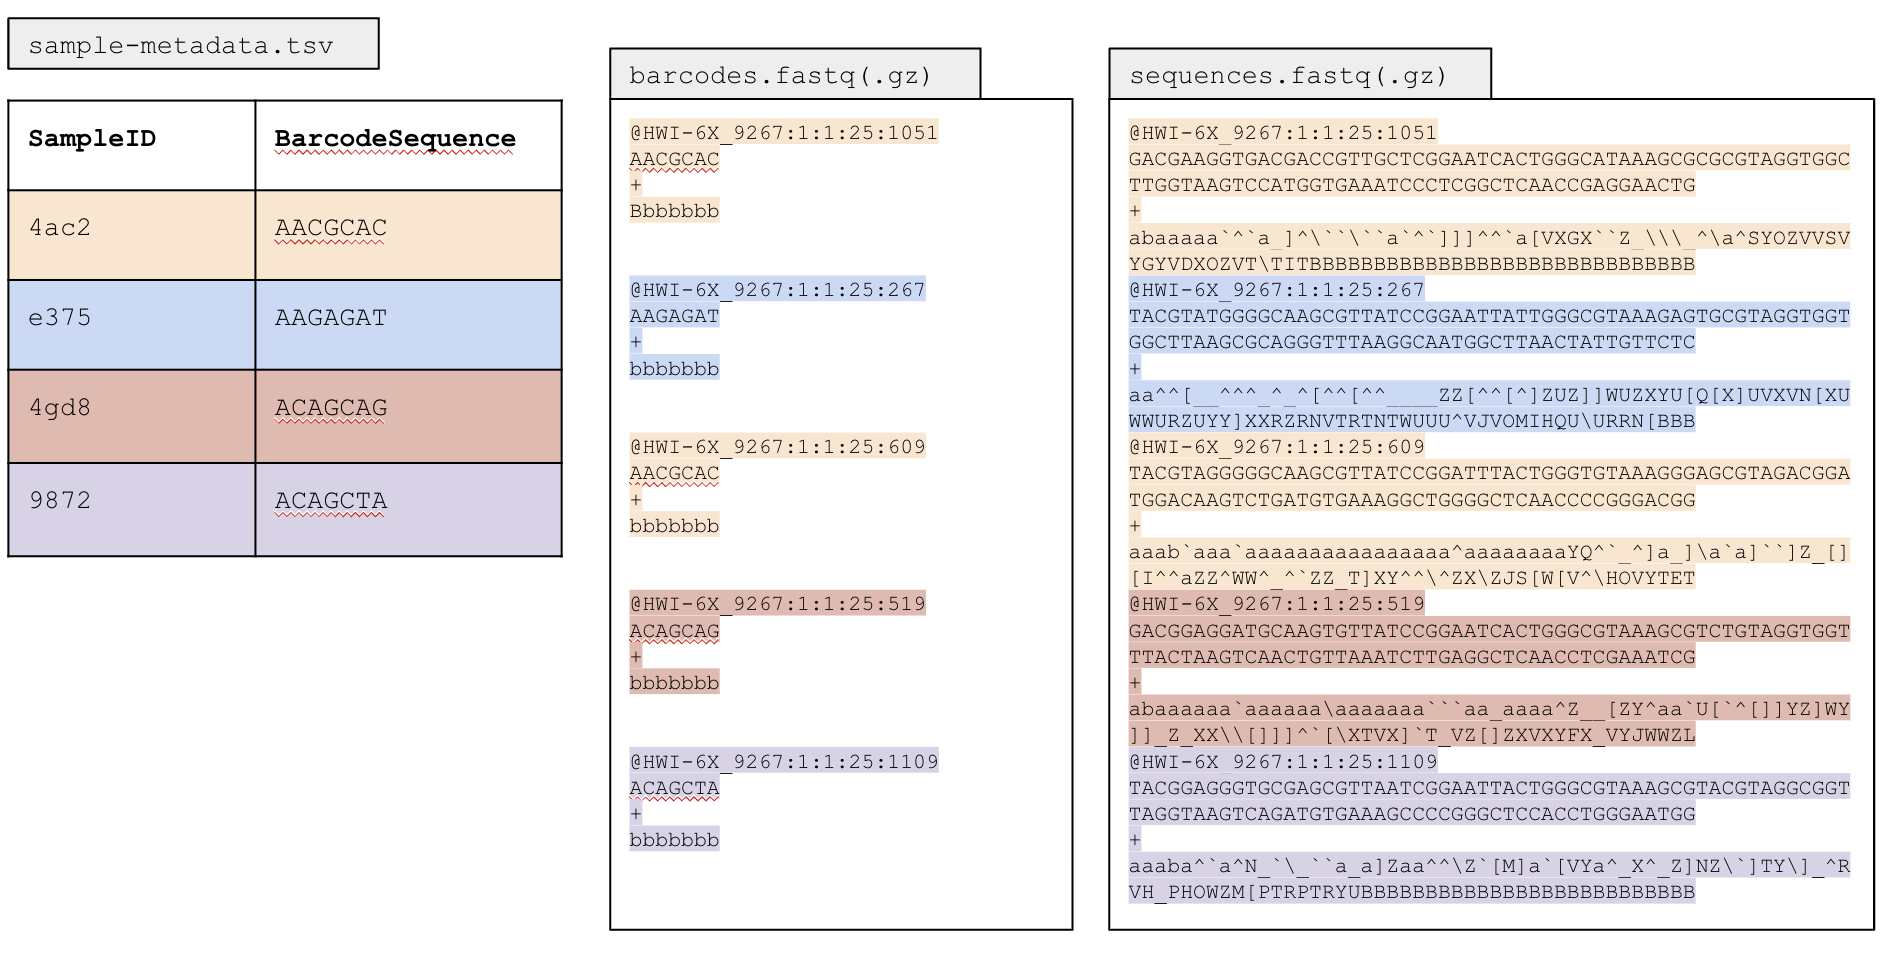
How does this work? When we incorporate the barcode during PCR, we know exactly what 12 bp barcode corresponds to each sample. We can record this in our metadata (YAY more metadata!). From the sequencer, we will get a sequences.fastq file (if it also has a .gz extension, that just means it is a zipped file), and a barcodes.fastq file.
Multiplexed data has all the sequences from all the samples in one file (the sequences.fastq file)!
- barcodes.fastq.gz will have the barcodes for each sample
- Your metadata file will contain the sample names and barcodes
- These 3 files together will enable you to demultiplex the sequences.
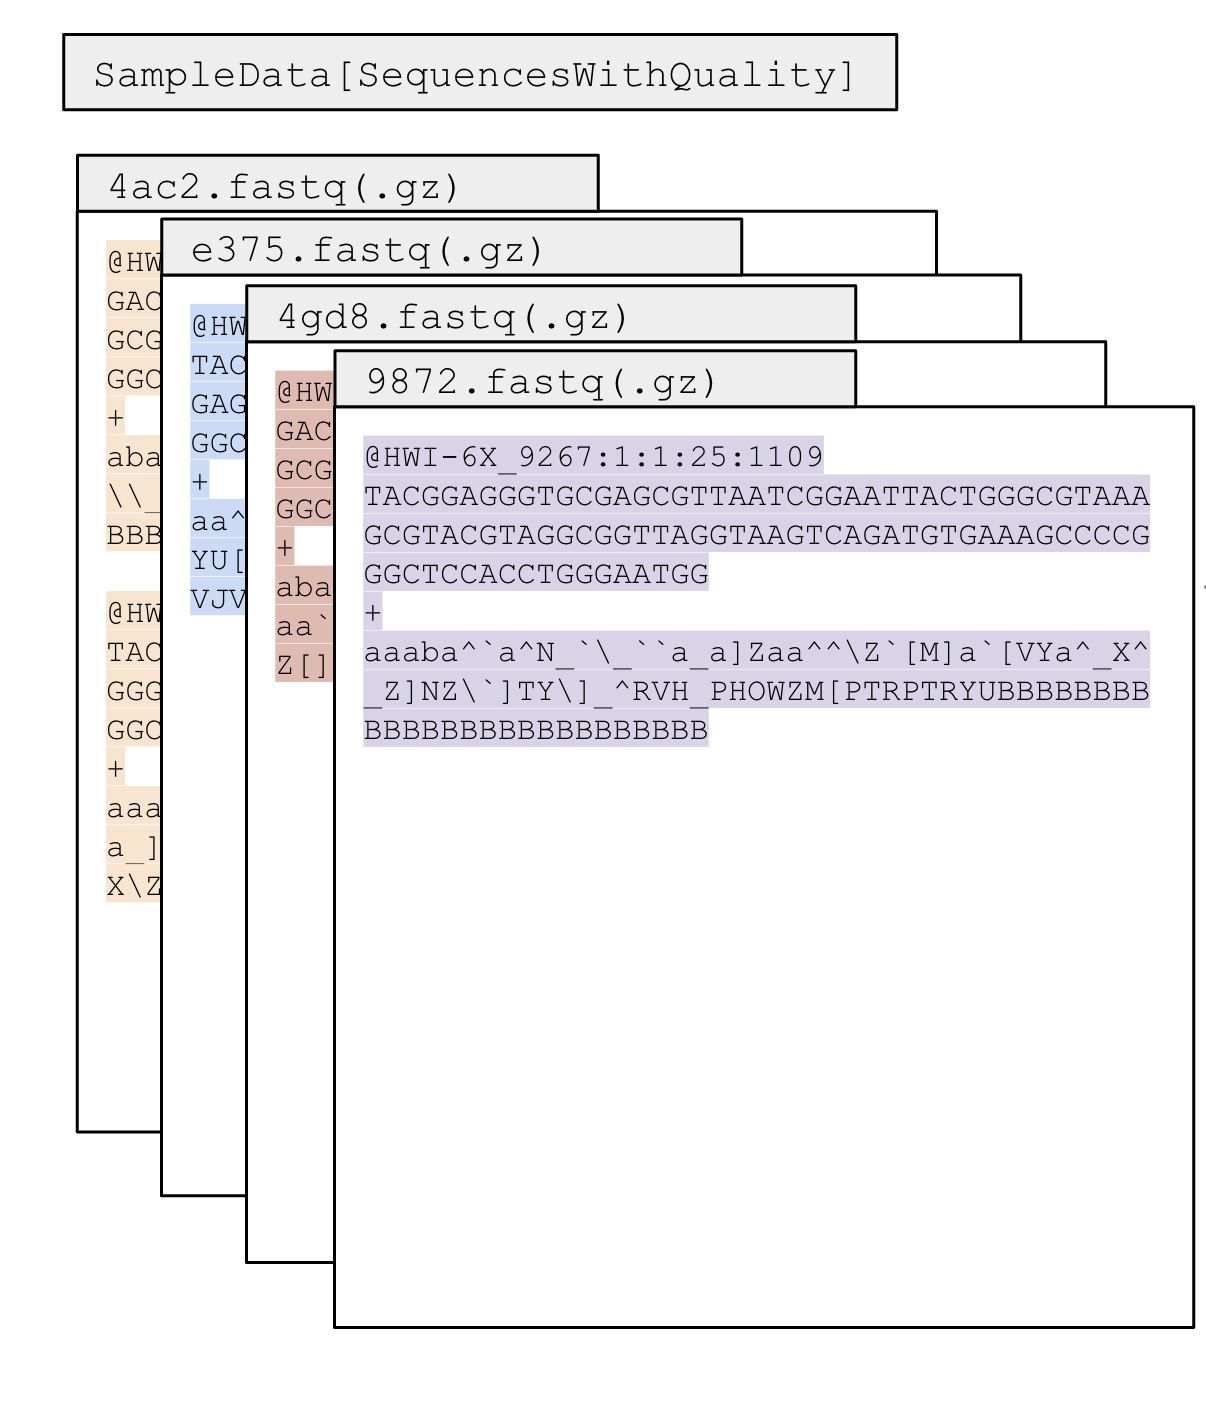
- Your output will be a fastq file per sample
Input:
Output:
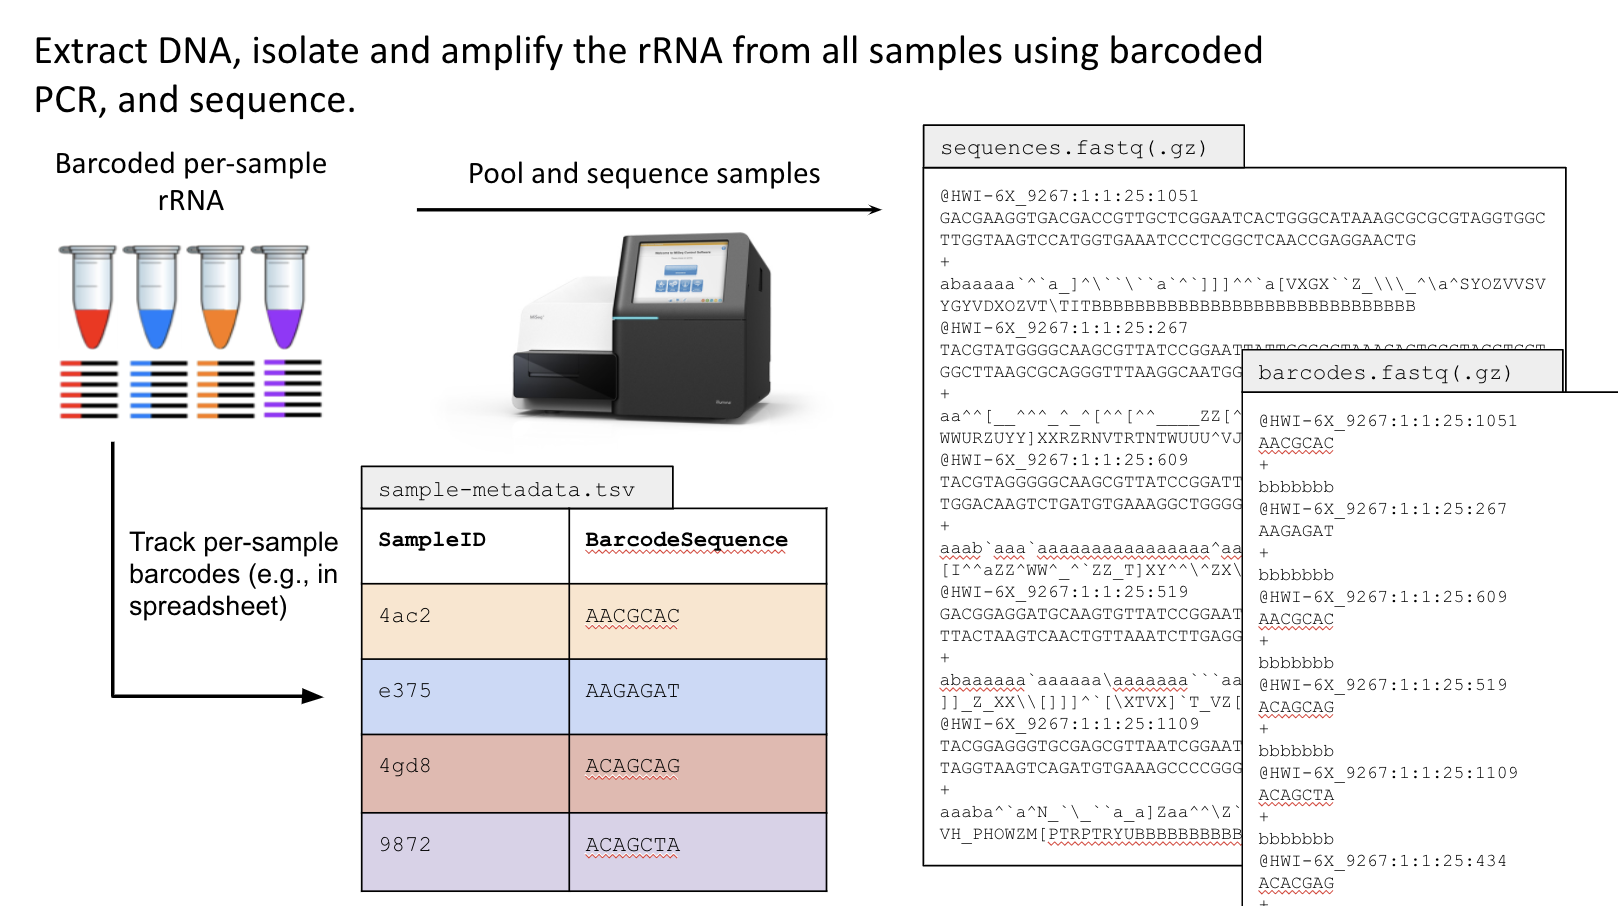
When we tell QIIME2 to demultiplex, we will give it our sequences.fastq and barcodes.fastq files, and it will use these files along with the barcode that we give it in our metadata file to separate the sequences by sample name. This is the whole workflow from the bench (adding the barcodes to each sample) so the output files we get from the sequencer:
Recall that the output sequences.fastq file is a specific file type that comes from the sequencer that contains 4 line types, where each set of 4 lines corresponds to one sequencing read. The first line is a sequencer identifier. This line you will likely never use, but it has some information about the sequencing run.
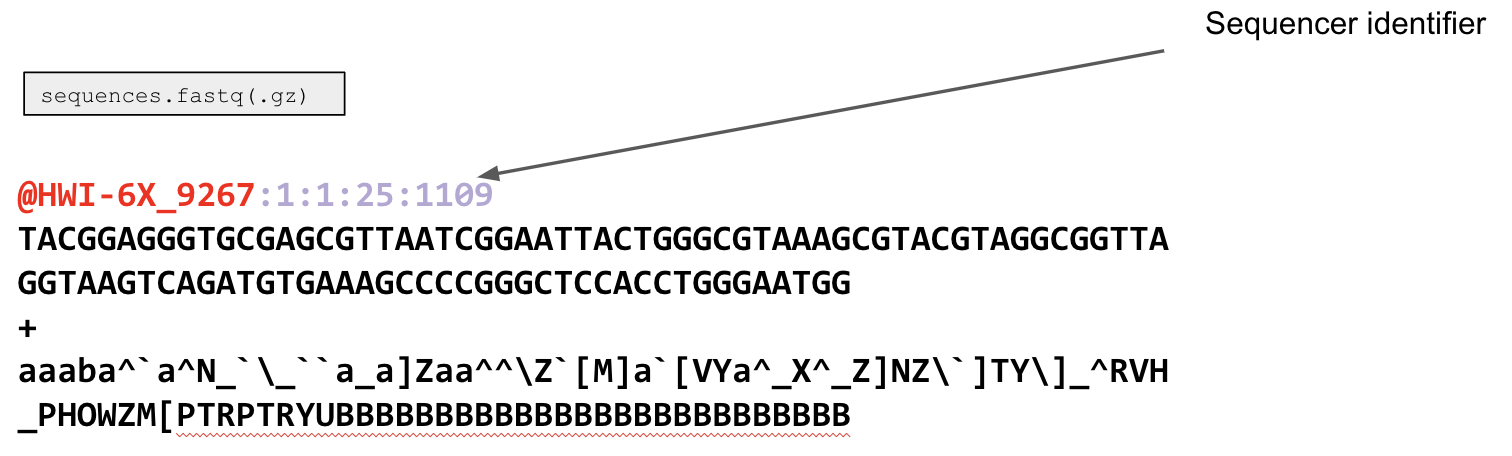 The second line is either the sequence (150 or 250 bp long depending on your chemistry for an Illumina Miseq run), or it is your barcode.
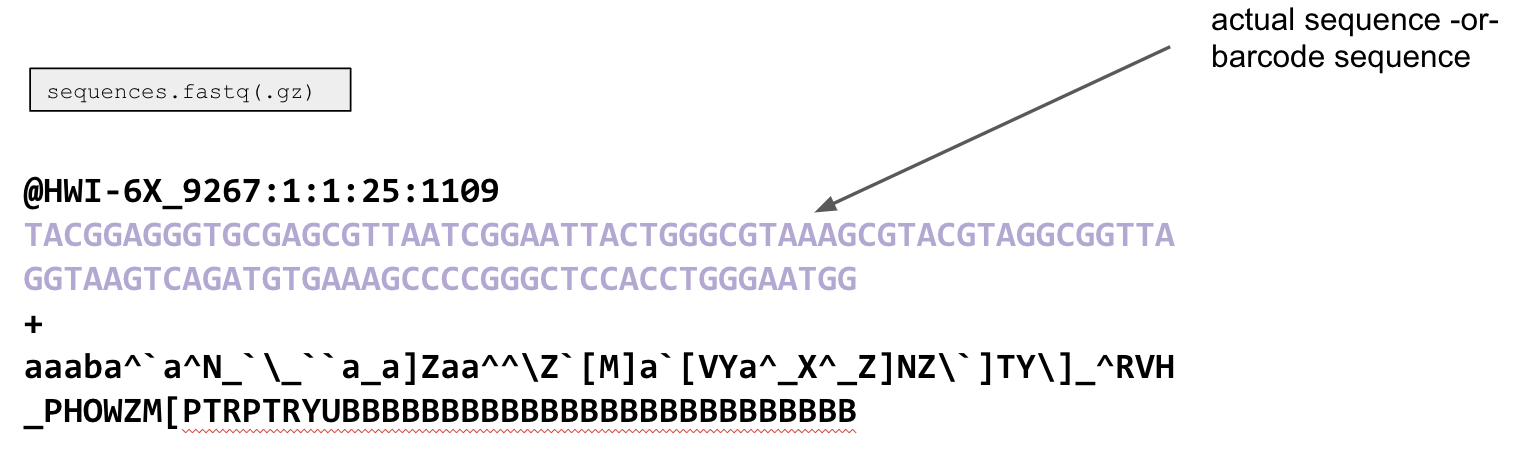 The "+" in the third line is just a placeholder. The purpose of this is to signal the end of the sequence and the start of the next line.
The fourth and final line looks like a bunch of gibberish, but it has information about the quality of your sequence. This line will always be the same length as the sequence (or barcode), as each character corresponds to the quality of a single base pair.
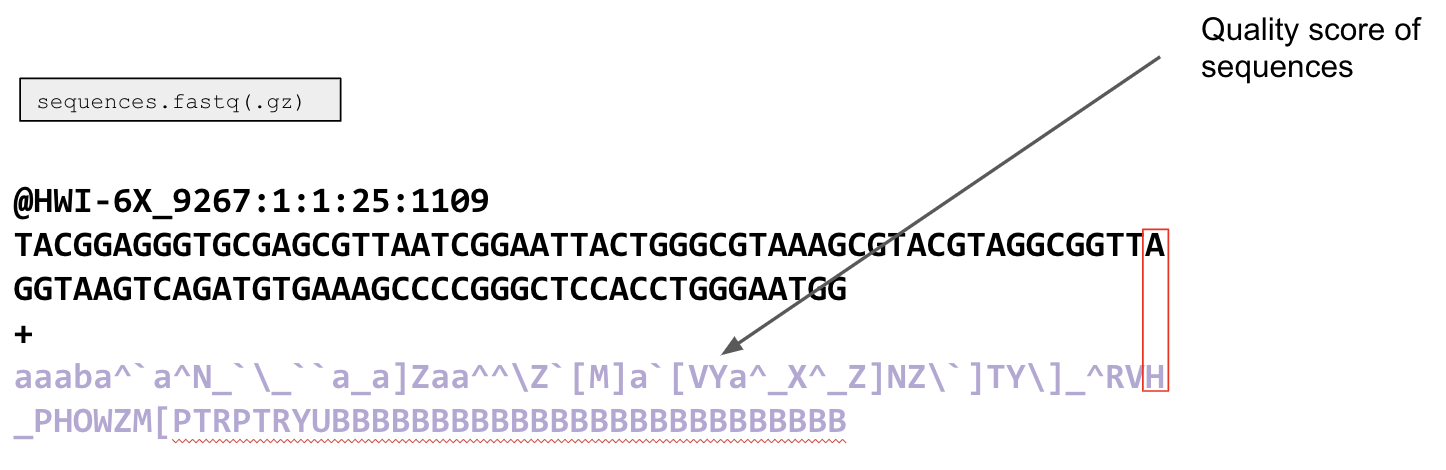
The quality scores can then be converted into phred quality scores using an ASCII coding system. A phred score is a single number that corresponds to a single base pair within a sequence, and that number tells us the probability that the base at that position is correct. See the below chart on the left for phred scores and what they mean for how accurate a base might be.
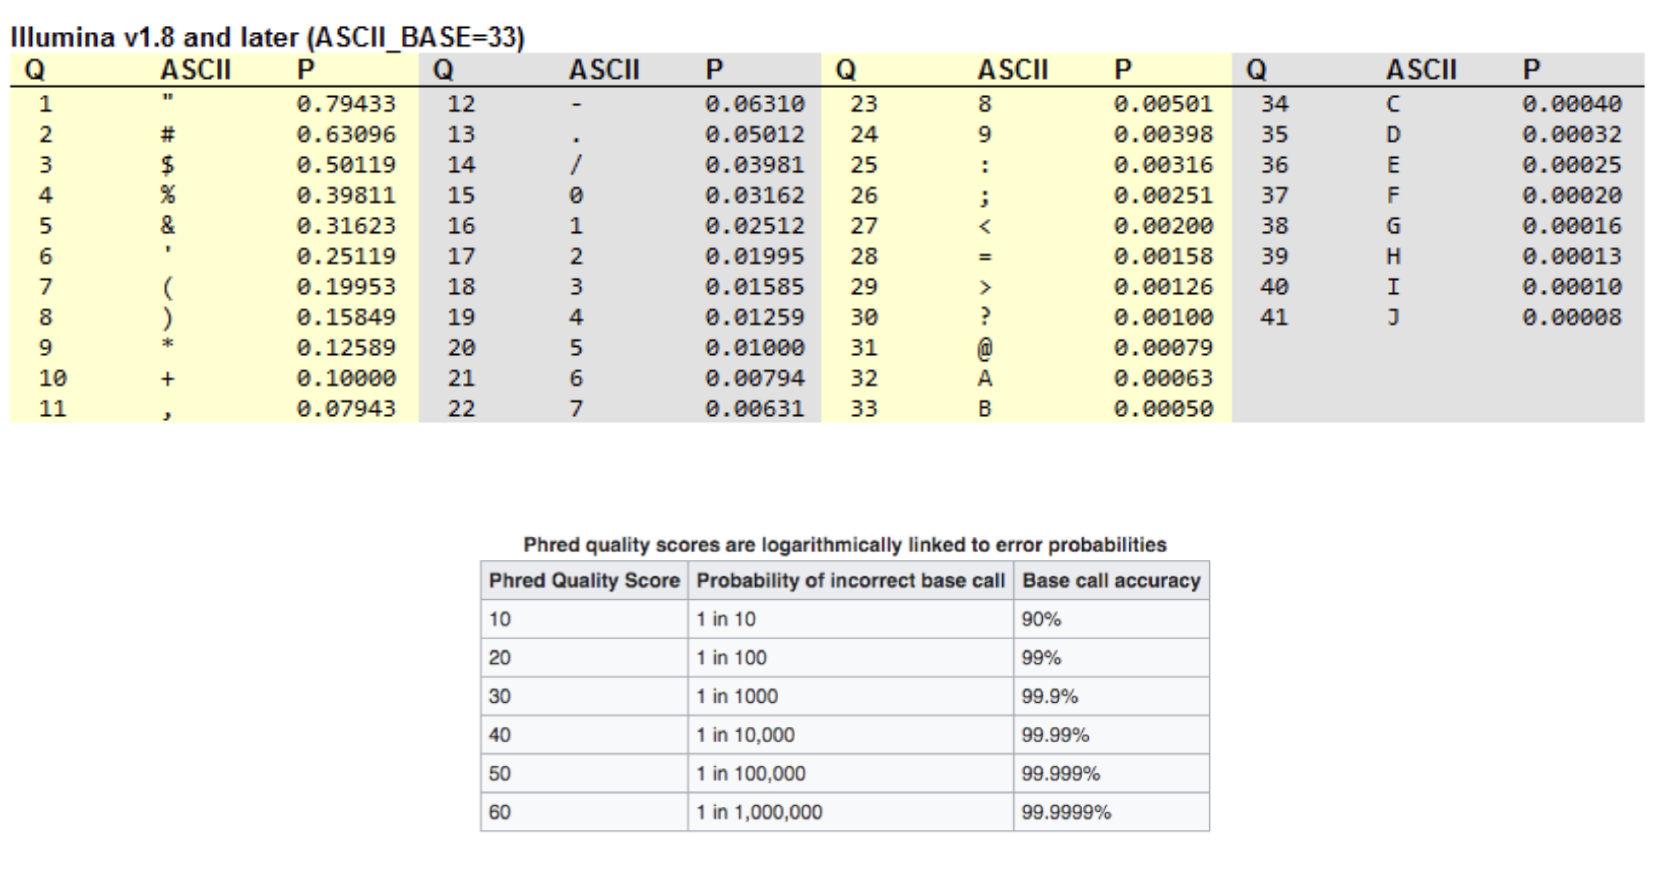
What Phred Score should you aim to have?
While there is no "correct" phred score, it's good to shoot for one of at least 30. It is okay if you need to keep some bases with a phred score of lower than this, but it is always dependent on the dataset itself. This is something we will explore later in our tutorials.
Why review this?
For the decomp dataset we will skip demultiplexing and instead import by a manifest file, but for the cow dataset (day 3 of the workshop) you will practice demultiplexing from raw data files. For both datasets you will practice reviewing the demultiplexed data for its quality which will inform your denoising choices.
Importing Sequences Using Manifest File for the Decomp Tutorial
The decomp dataset sequences have already been demultiplexed (some sequencing facilities will demultiplex for you, some wont so its important to know how to import for both ways), so we will import them using the fastq manifest format. This is when we have a fastq file for each sample, and when we import, we need to give the path for each fastq sample file in a .tsv or .txt file. This tells QIIME2 where to look for the fastq files for each sample and it will combine them into one .qza file that we can use for downstream analyses.
Here, we will import the sequences as SampleData[PairedEndSequencesWithQuality], because we have paired end data that contains Phred scores in the sequences file. this means we have 2 files per sample (a fastq files with all the forward reads and a fastq file with all the reverse reads) and the quality scores are included in the files.
Lets get started!
Let's navigate to the correct place. Use cd to move into your decomp_tutorial folder. Use pwd to make sure you're in the correct place.
Create directories for the different analyses so you can keep your files organized:
mkdir slurm
mkdir taxonomy
mkdir tree
mkdir taxaplots
mkdir dada2
mkdir demux
1. Get the Manifest Files
Make sure you are in the decomp tutorial directory
You can use this website to build or check your manifest to make sure the formatting is correct: https://gregcaporaso.github.io/fq-manifestor-web/
Now copy the manifest files for both sequencing runs into your working directory:
2. Get the Demultiplexed Reads
Copy the FASTQ read directories for both runs:
Let's take a look at the data we just imported, we can do this by moving into the reads folder, and typing ls3. Import Run 2
qiime tools import \
--type "SampleData[PairedEndSequencesWithQuality]" \
--input-format PairedEndFastqManifestPhred33V2 \
--input-path manifest_run2.txt \
--output-path demux/demux_run2.qza
4. Visualize Run 2
Check Data Quality: The first important step of data analysis is to check the data quality. Now that we've gotten our data into QIIME2 it's simple to get a visualization that we can use to evaluate our sample quality.
Viewing .qzv files
Drag and drop any .qzv file onto view.qiime2.org to explore it interactively. The demux summarize visualization shows per-sample read counts and per-position quality score distributions, use these to choose truncation lengths for DADA2.
Review both run visualizations using this checklist before moving on:
5. Import Run 3
--type, QIIME2 semantic type. For demultiplexed paired-end FASTQ: SampleData[PairedEndSequencesWithQuality]--input-format, Manifest format + quality encoding. PairedEndFastqManifestPhred33V2 means a manifest with forward and reverse paths per sample, Phred+33 encoded.
6. Visualize Run 3
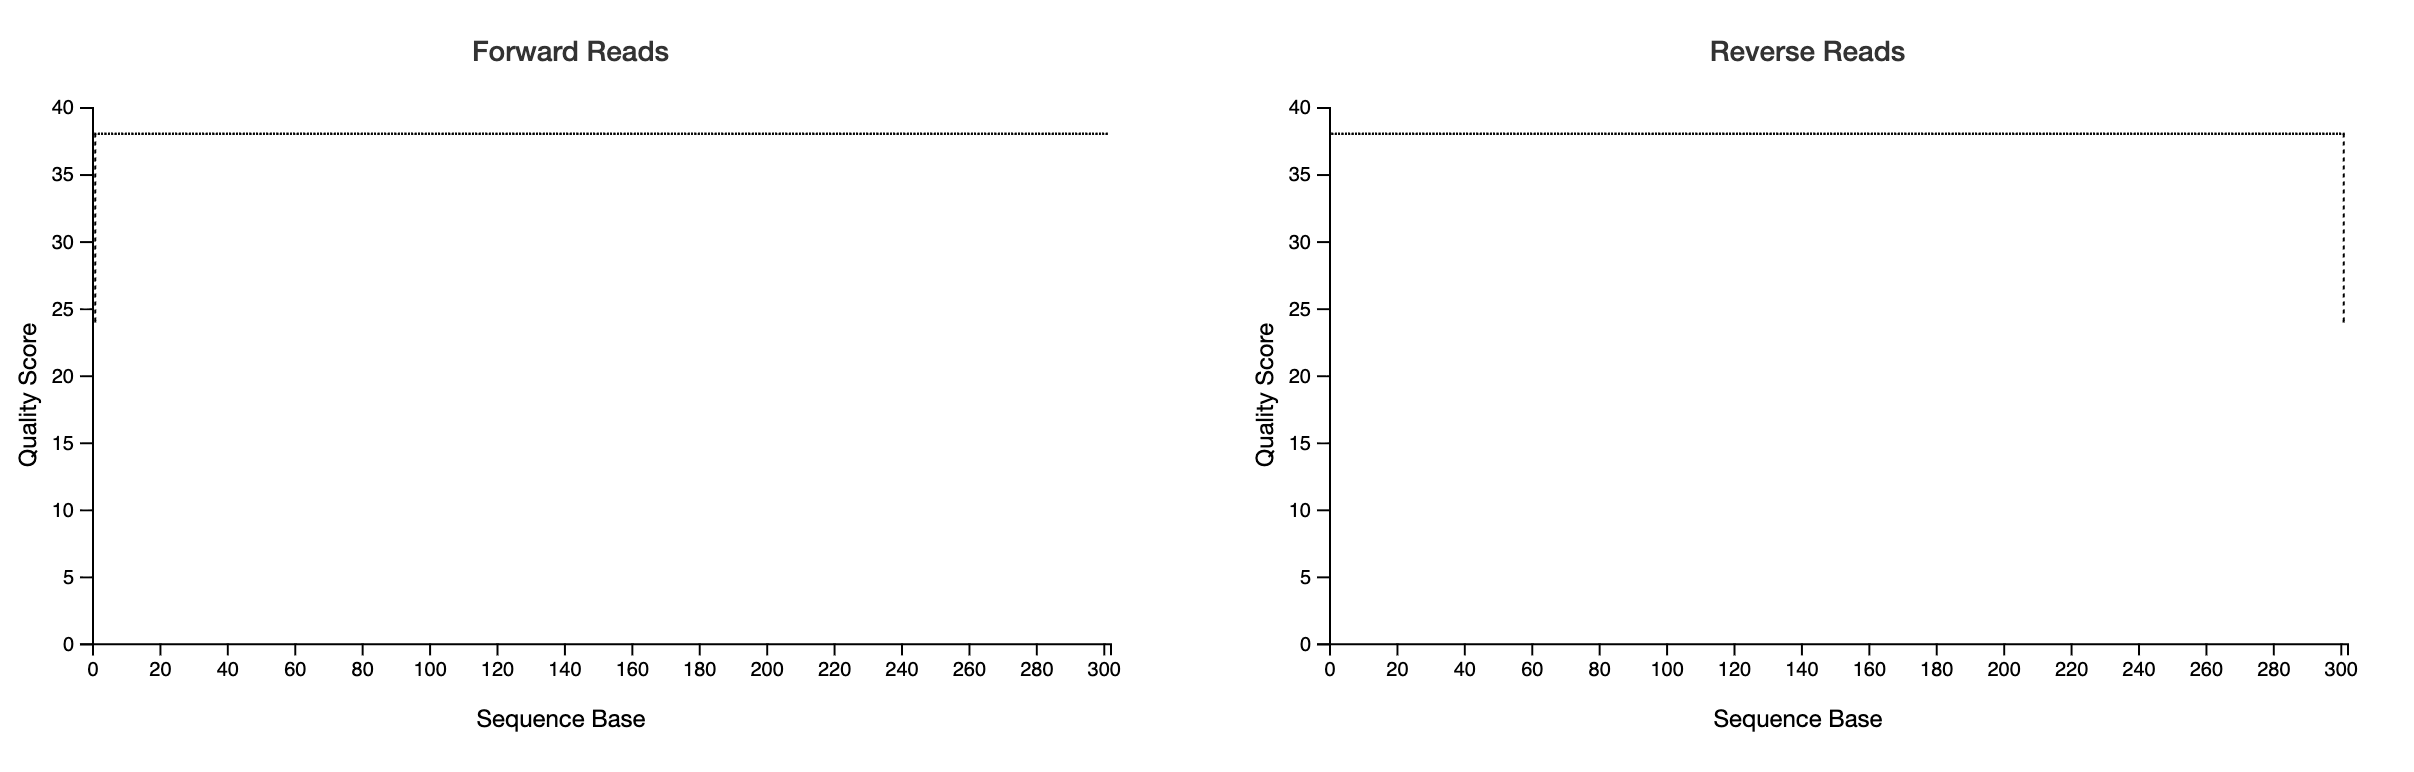
A Note About Binned Quality Scores
Some sequencing platforms (e.g. newer Illumina instruments like the MiSeq i100) do not report individual Phred quality scores for each base. Instead, they use binned quality scores, where ranges of quality values are grouped and reported as a single representative score. This reduces file size and improves data compression, but it changes how quality information is encoded in your FASTQ files.
Rather than seeing the full range of Phred scores (e.g., 0–41), bases are assigned to one of four quality bins, which are reported as:
2 → very low quality bases
9 → low quality bases
23 → moderate quality bases
38 → high quality bases
Each of these values represents a range of underlying Phred scores rather than an exact estimate of sequencing accuracy. For example, a base reported with a quality score of 38 may represent any base whose true quality falls within the highest bin.
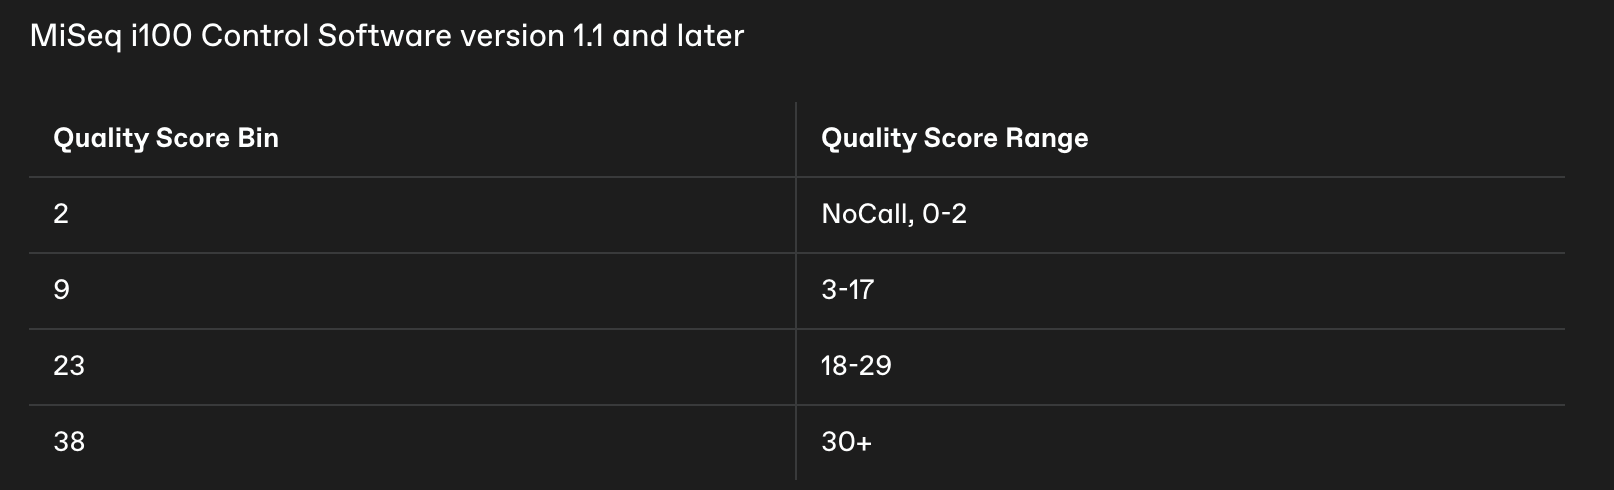
This means that your demultiplexed sequences from your demux.qzv might look like this:
Outputs
| File | Type | Description |
|---|---|---|
demux_run2.qza |
Artifact | Imported sequences, run 2 |
demux_run2.qzv |
Visualization | Summary of run 2 read quality |
demux_run3.qza |
Artifact | Imported sequences, run 3 |
demux_run3.qzv |
Visualization | Summary of run 3 read quality |
Next: Denoising with DADA2