Beta Diversity
Distance Matrices:
You may recall from alpha diversity that each sample has its own alpha diversity measure. If you want, you can add alpha diversity as a column to your metadata because no matter what comparison you're making the alpha diversity for a sample is the same as any other value in the metadata (e.g., day you took the sample). In beta diversity, however, it is very dependent on which two samples we’re comparing. So we end up with a matrix like this because we are comparing the samples to one another:
Beta diversity describes differences in community composition between samples. We use PERMANOVA to test whether sample groups differ significantly in community composition, and ADONIS for multi-factor models.
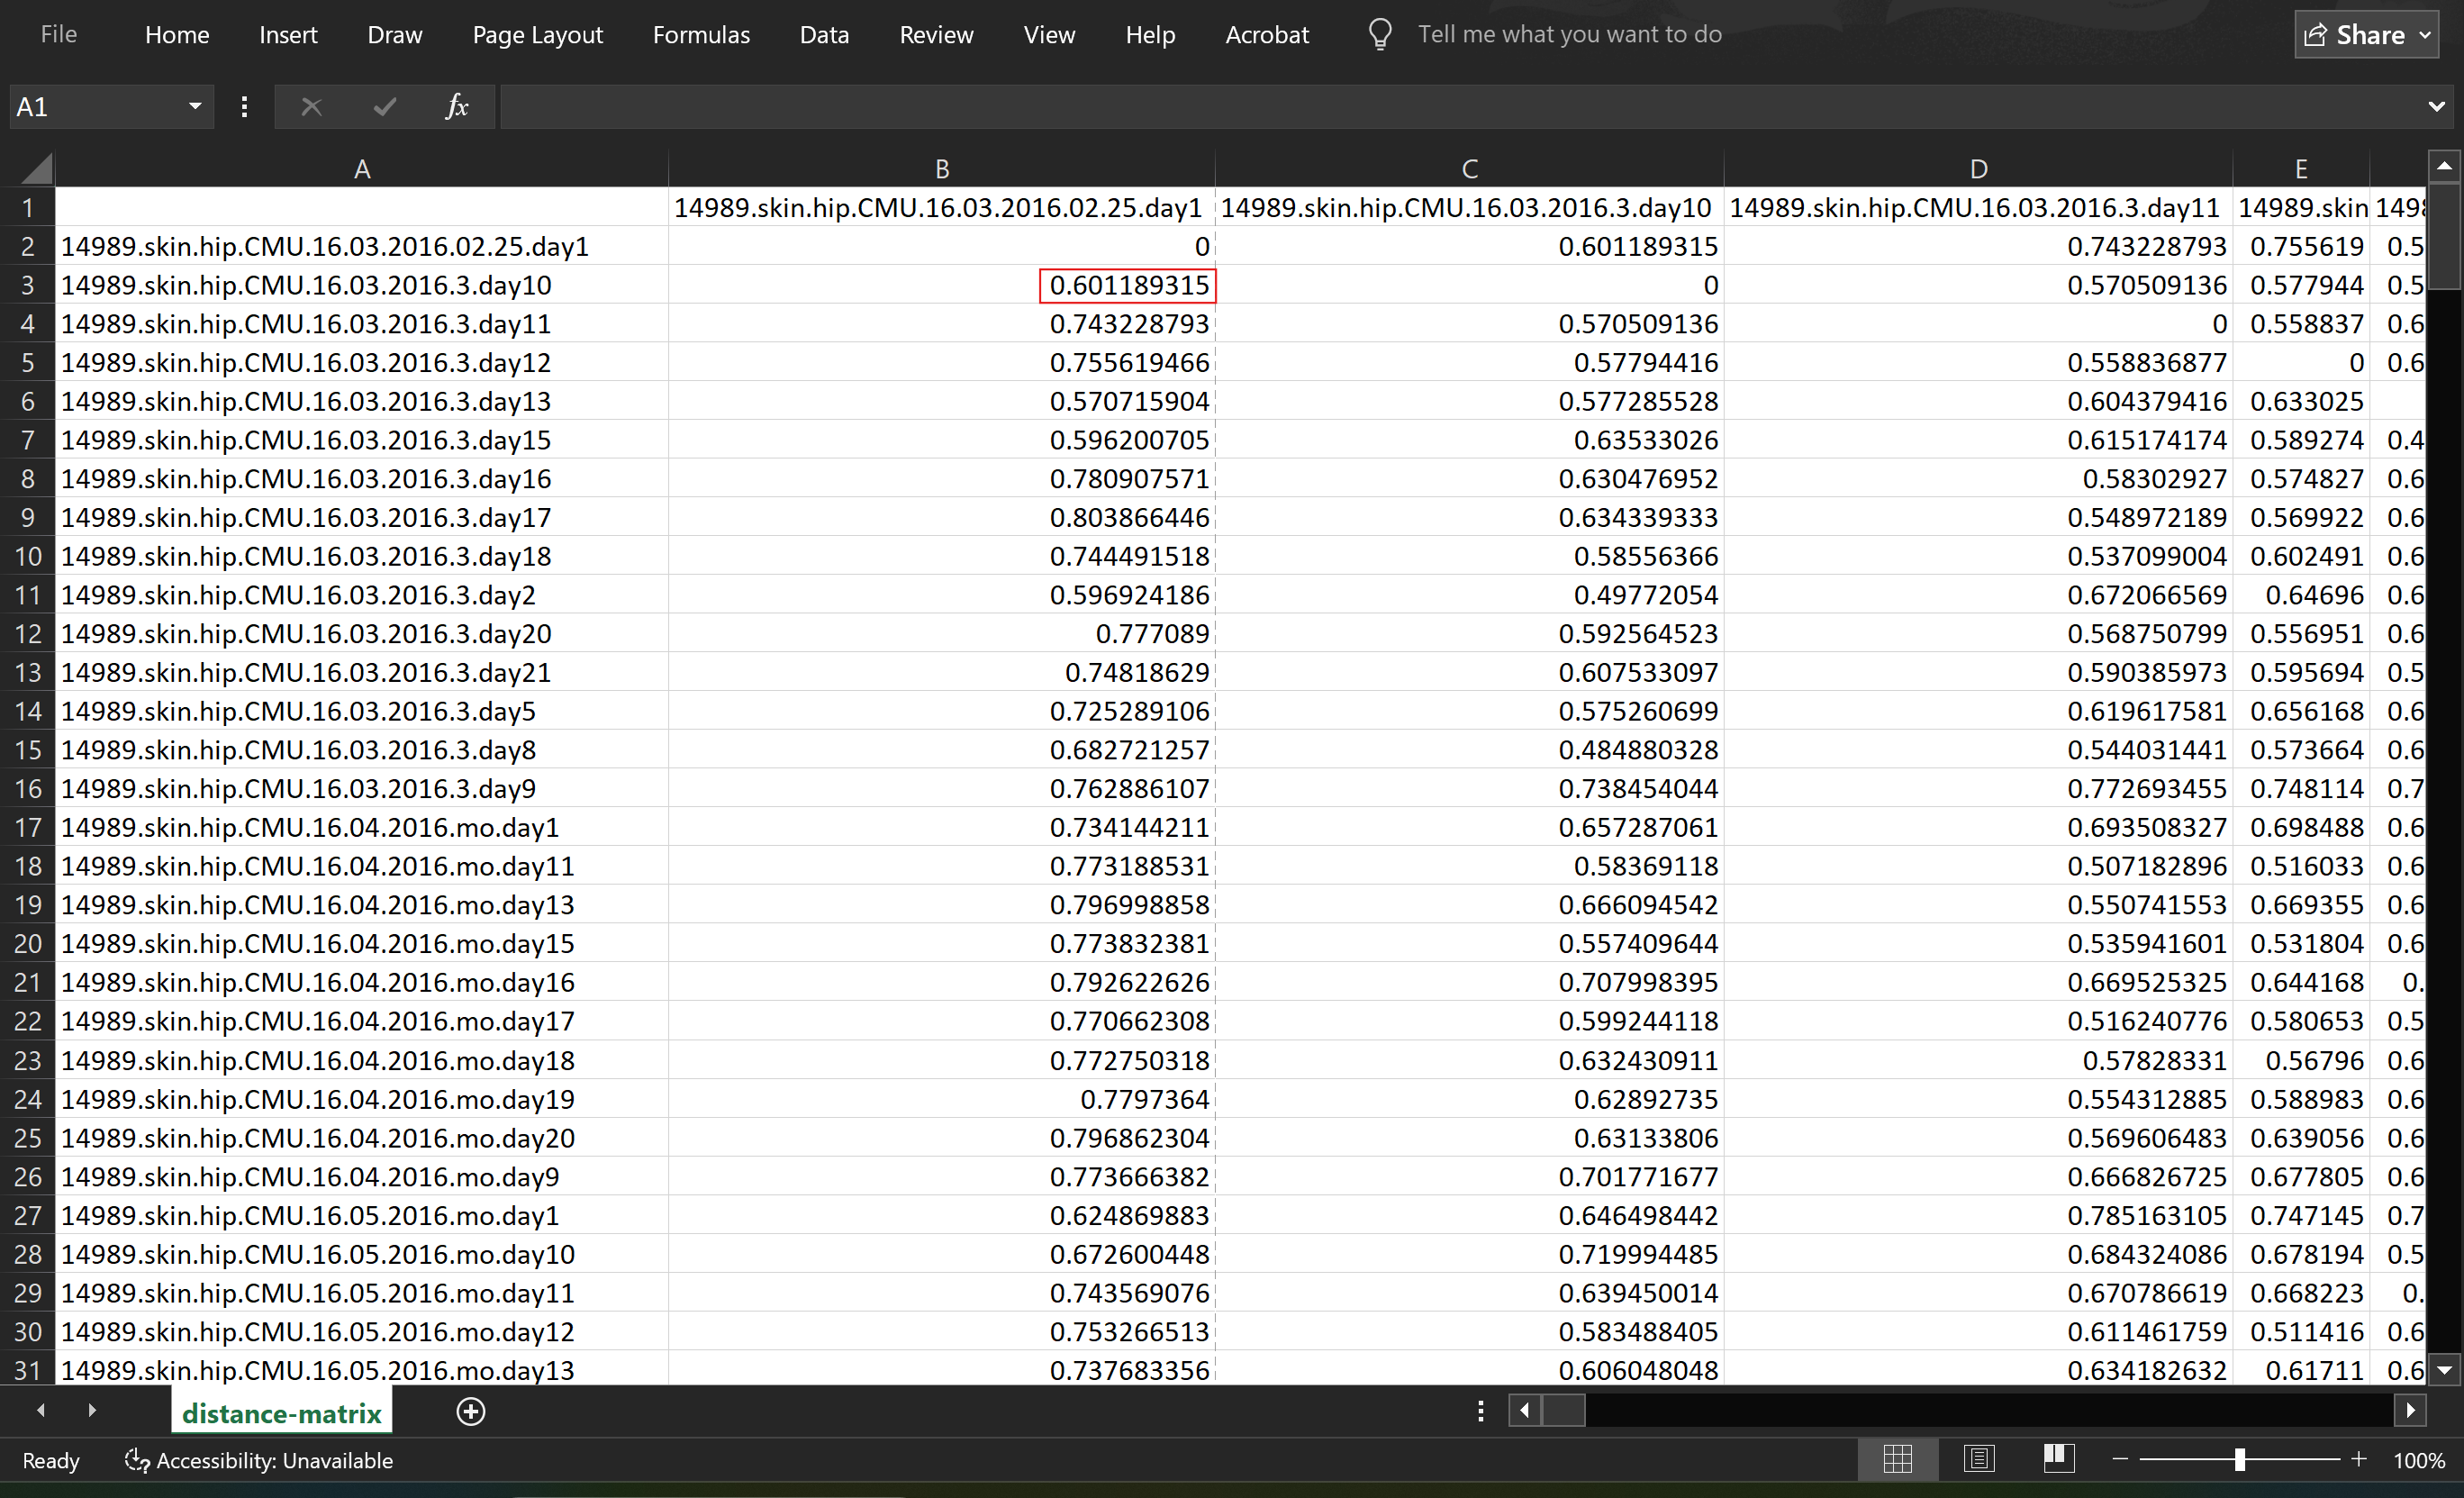
Notice the sample names at the top are repeated in each row.
So what we're looking at is the distance those two samples are from each other and how different they are. These are usually calculated on a scale from 0 to 1, with 0 being exactly the same, and 1 being more "distant" or more "dissimilar" and 0 being "closer" or "more similar". So, these two samples in this top left hand corner are exactly the same (so you'll see that the distance is 0 because they're the same sample- so there's no difference between them).
But! If the samples are somewhat different (Highlighted red box), we see a distance of ~0.6. So again what we're looking at is a direct comparison between every single sample in your entire data set to determine how similar or different the microbial communities are.
Because of the complexity/size, we don't usually look at the distance matrices themselves but rather we visualize them with ordination plots like Principal Coordinates Analysis (PCoA)/umaps/NMDS/etc.
Beta Diversity Files
Which core-diversity-metric files are beta diversity and what do they mean? Plus, let's check them out in Emperor
-
Weighted = considers ASV abundance
-
Unweighted = does not consider ASV abundance, but rather presence or absence.
-
Phylogenetic = measures the degree to which species are phylogenetically related
-
Non-phylogenetic = does not account for phylogenetic relatedness.
Unweighted UniFrac: Unweighted, phylogenetic. Measures the richness of the species and the number of shared branches in the phylogenetic tree. Unweighted UniFrac is more sensitive to differences in low-abundance features. May overrepresent rare features because everything that is present is counted as 1.
core_metrics/unweighted_unifrac_emperor.qzv
Weighted Unifrac: Weighted, phylogenetic. Measures the richness and evenness of the species and the number of shared branches in the phylogenetic tree. Weighted UniFrac is useful for examining differences in community structure. You may see less separation in this visualization compared to the unweighted, that is because the most prominent features are present similarly in both groups. So taxa abundance is accounted for.
core_metrics/weighted_unifrac_emperor.qzv
Jaccard: Unweighted, non-phylogenetic. Measures how many shared microbes there are between the samples. So the fraction of unique features, regardless of abundance.
core_metrics/jaccard_emperor.qzv
Bray Curtis: Weighted, non-phylogenetic. Uses richness and evenness to measure how many features are shared and the abundance of those features. Good when you have highly abundant species!
core_metrics/bray_curtis_emperor.qzv
Let's explore the following files:
core_metrics/unweighted_unifrac_emperor.qzv
core_metrics/bray_curtis_emperor.qzv
As you click through different metadata colorings, are you seeing any separation between the data points? What metadata category best describes this separation?
Are there any visual differences between unweighted unifrac and bray curtis?
Note that these visualizations are just highlighting the qualitative differences (things we can see that looks like real differences), we need stats to tell us about the actual quantitative differences (what is statistically different).
Testing for significance
How do we know what is significant or meaningful to our analysis? We test using Beta Group Significance commands in a variety of ways.
Beta Group Significance will determine whether groups of samples are significantly different from one another using a permutation-based (PERMANOVA) statistical test.
We are testing the hypothesis that samples within a group are more similar to each other than they are in samples to another group. In other words, it tests whether the within-group distances from each group are different from the between-group distance. Samples that are similar to each other will have smaller distances from each other. Read this paper for more about PERMANOVA: https://onlinelibrary.wiley.com/doi/full/10.1111/j.1442-9993.2001.01070.pp.x
Use PERMANOVA when:
-
You want to test whether overall community composition differs between groups
-
Your samples are independent
-
You are testing categorical predictors (e.g., treatment, sample type, facility)
-
You are working directly with a distance matrix (Bray–Curtis, UniFrac, Jaccard, etc.)
PERMANOVA is ideal for:
- Cross-sectional studies
- One-time-point comparisons
- Simple group comparisons
You cannot use PERMANOVA when:
-
You have repeated measures (longitudinal data), this is because samples from the same subject are not independent
-
You want to model continuous predictors (e.g., time)
- You want to include multiple covariates with complex structure
PERMANOVA assumes independence of samples. In longitudinal microbiome data, that assumption is violated because samples from the same subject over time are correlated. (If you want to use permanova you can use permutation restrains but as a study becomes more complecated this becomes more difficult to do)
PERMANOVA is not appropriate for this study; however, we want to demonstrate how to run PERMANOVA so you can use it for your homework assignment, where it is appropriate.
PERMANOVA
Unweighted UniFrac
Unweighted UniFrac considers only presence/absence of lineages (not their relative abundance):
qiime diversity beta-group-significance \
--i-distance-matrix core_metrics/unweighted_unifrac_distance_matrix.qza \
--m-metadata-file metadata/metadata.txt \
--m-metadata-column sample_type \
--o-visualization core_metrics/unweighted_unifrac_distance_matrix.qzv
PERMANOVA
Weighted UniFrac
Weighted UniFrac accounts for the relative abundance of lineages:
  qiime diversity beta-group-significance \
--i-distance-matrix core_metrics/weighted_unifrac_distance_matrix.qza \
--m-metadata-file metadata/metadata.txt \
--m-metadata-column sample_type \
--o-visualization core_metrics/weighted_unifrac_distance_matrix.qzv
PERMANOVA
Bray Curtis
Bray Curtis uses richness and evenness:
qiime diversity beta-group-significance \
--i-distance-matrix core_metrics/bray_curtis_distance_matrix.qza \
--m-metadata-file metadata/metadata.txt \
--m-metadata-column body_site \
--o-visualization core_metrics/bray_curtis_distance_matrix.qzv
- Adonis under the qiime diversity plugin, allows for more than a one-way (multifactor) permanova, therefore you could use use ADONIS to test the additive effects.
PERMANOVA
Soil Samples by Facility
First filter to soil samples and re-run core metrics (if not already done in the alpha diversity step):
qiime feature-table filter-samples \
--i-table dada2/table_nomitochloro.qza \
--m-metadata-file metadata/metadata.txt \
--p-where "[sample_type]='soil'" \
--o-filtered-table dada2/table_nomitochloro_soil.qza
qiime diversity core-metrics-phylogenetic \
--i-table dada2/table_nomitochloro_soil.qza \
--i-phylogeny tree/tree_gg2.qza \
--m-metadata-file metadata/metadata.txt \
--p-sampling-depth 5000 \
--output-dir core_metrics_soil
Test for facility effects within soil samples:
qiime diversity beta-group-significance \
--i-distance-matrix core_metrics_soil/unweighted_unifrac_distance_matrix.qza \
--m-metadata-file metadata/metadata.txt \
--m-metadata-column facility \
--o-visualization core_metrics_soil/unweighted_unifrac_facility_significance.qzv
Outputs
| File | Type | Description |
|---|---|---|
core_metrics/unweighted_unifrac_sample_type_significance.qzv |
Visualization | PERMANOVA by sample type (unweighted) |
core_metrics/weighted_unifrac_sample_type_significance.qzv |
Visualization | PERMANOVA by sample type (weighted) |
core_metrics/weighted_adonis.qzv |
Visualization | ADONIS multi-factor model |
core_metrics_soil/unweighted_unifrac_facility_significance.qzv |
Visualization | PERMANOVA by facility (soil only) |