Taxonomic Classification
Taxonomic Classification
The representative sequences file from Dada2 contained Feature IDs and the sequences. Now, let's classify our ASVs to assign each one its microbial taxonomy. Recall that there are a variety of databases that can be used to classify taxonomy:
-
Greengenes2 - reference tree that includes integrated 16S rRNA regions, full-length 16S rRNA full genes, and whole genome information
-
SILVA - high quality ribosomal RNA database Ribosomal Database ProjectLinks to an external site. (RDP) - quality controlled, aligned, and annotated 16S rRNA sequences
-
NCBI Reference Sequence DatabaseLinks to an external site. (RefSeq) - a comprehensive, integrated, non-redundant, well-annotated set of reference sequences including genomic, transcript, and protein.
-
GenBank - the NIH genetic sequence database, an annotated collection of all publicly available DNA sequences
-
Genome Taxonomy Database - a standardised microbial taxonomy based on genome phylogeny
-
Web of Life - reference phylogeny for microbes After some internal testing in our lab, we find we get the best, and most, classifications by using Greengenes2.
We classify ASVs by comparing them to the GreenGenes2 reference database using a pre-trained Naive Bayes classifier. We then visualize taxonomic composition and remove reads that originated from host mitochondria and chloroplasts.
Key takeaways about Greengenes2 (gg2):
-
A reference tree that unifies genomic and 16S rRNA databases into a consistent, integrated source
-
Includes nearly 16K bacterial and archaeal whole genomes, 18K full-length 16S rRNA sequences, 1.7 million near-complete 16S rRNA genes, and over 23 million 16S rRNA V4 region sequences, all compiled from a variety of sources
-
Yields a reference tree covering over 21 million sequences from 31 different types of environments
For the purpose of this class, we will use the pre-trained classifier version of gg2 that was trained on the V4 hypervariable region (corresponding to the 515F-806R primers).
Get the Taxonomic Classifier
Copy the pre-trained GreenGenes2 V4 classifier:
# get the taxonomic classifier using wget
wget --no-check-certificate https://ftp.microbio.me/greengenes_release/2024.09/2024.09.backbone.v4.nb.qza
About the Classifier
This is a Naive Bayes classifier trained on the GreenGenes2 (2024.09) backbone sequences trimmed to the V4 hypervariable region. It is specific to the primer set and read length used in this workshop. For your own data you will need a classifier trained on the appropriate region.
The next command, uses the q2-feature-classifier plugin to classify the ASVs by its classify-sklearn method. This is machine-learning-based classification, in which classifiers must be trained, e.g., to learn which features best distinguish each taxonomic group, adding an additional step to the classification process.
Here is how you can visualize a "classifier":
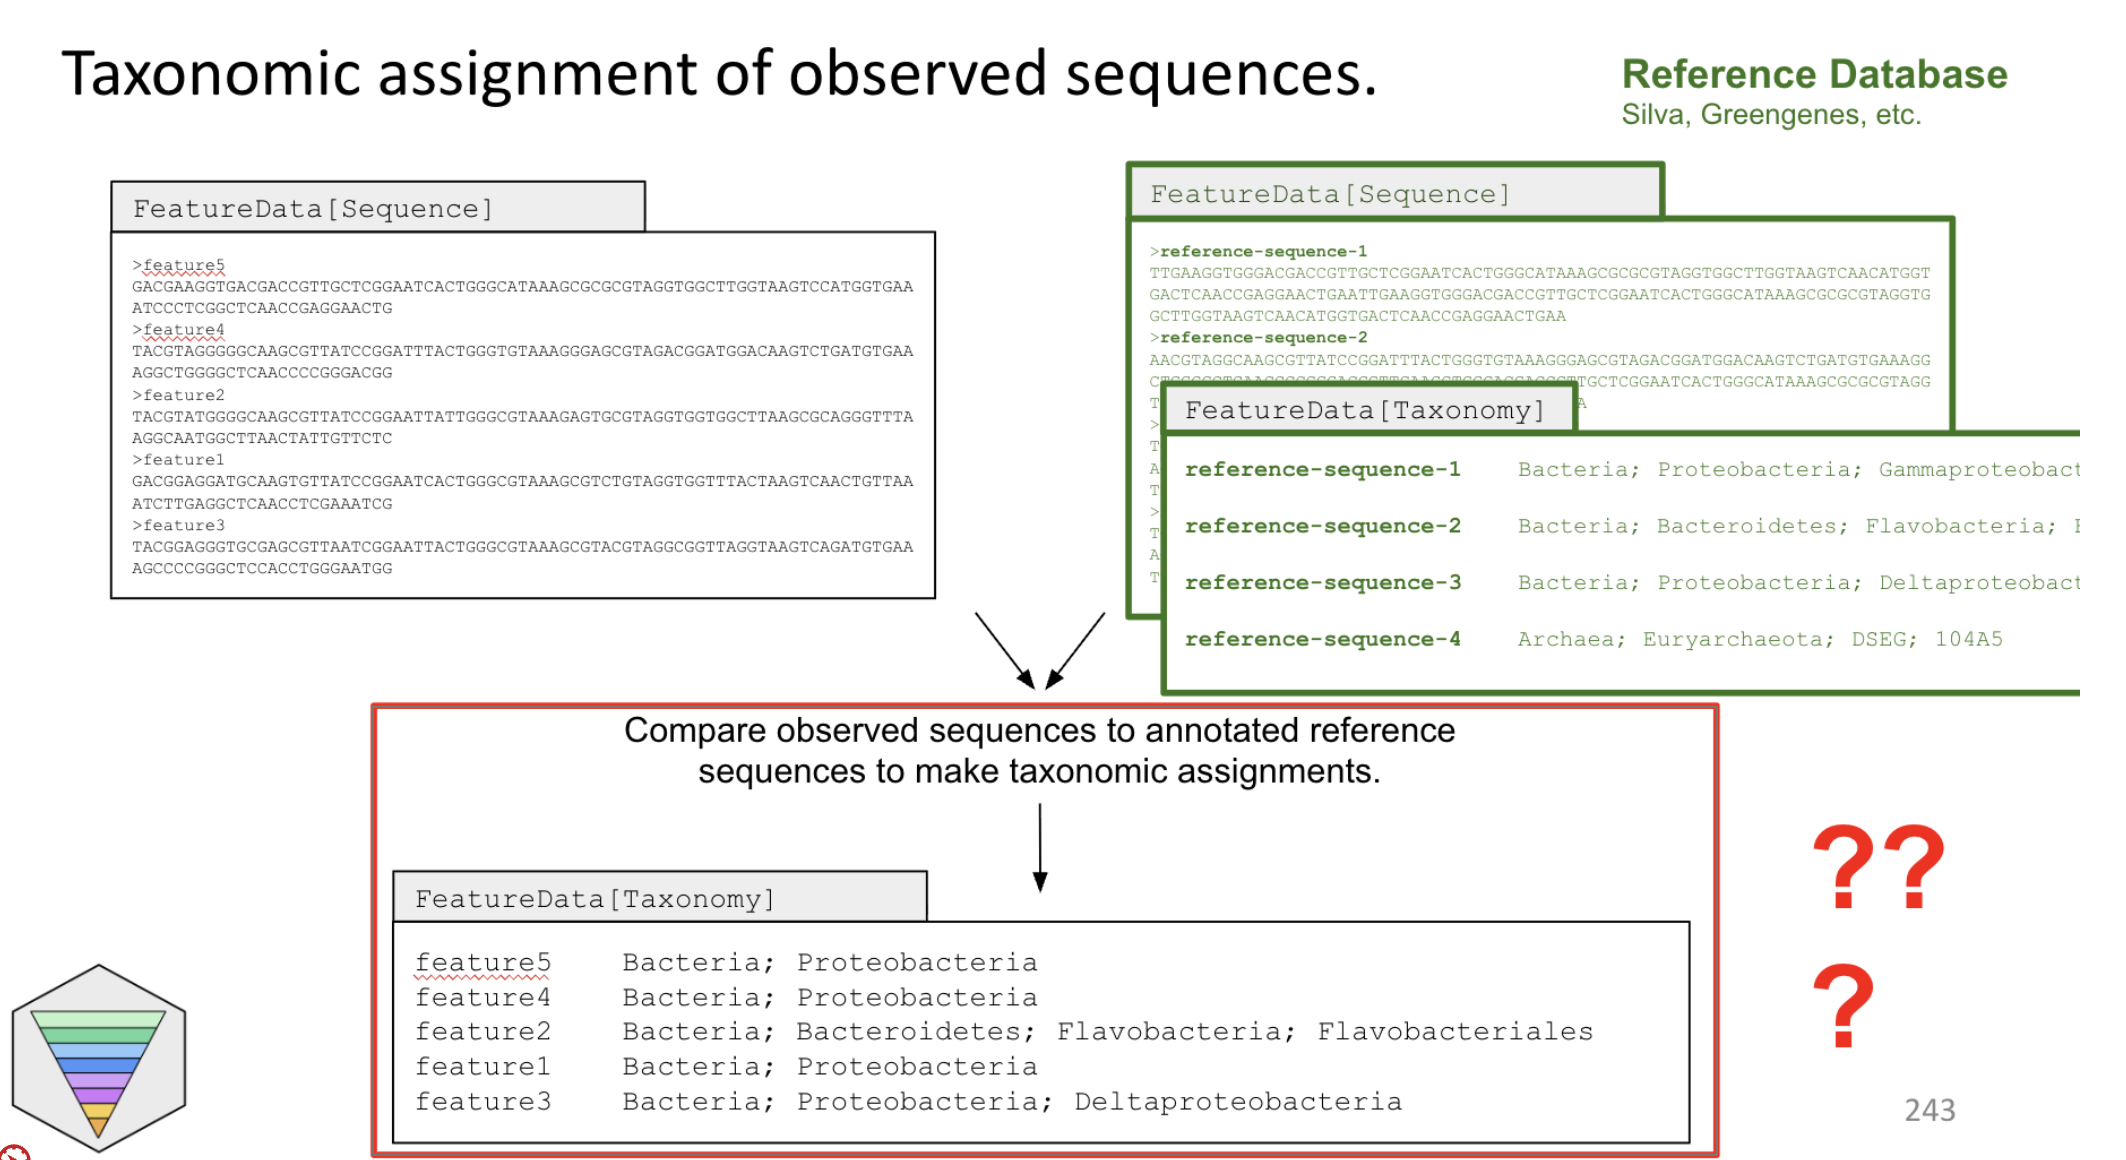
we give the classifier a reference database (with sequences and the associated taxonomic classification) (green boxes)
And tell the classifier, if you see a sequence like this, you should be returning a taxonomy label like this one (red boxes)
Use our representative reads to classify taxonomy, which will give us our taxonomy.qza output. This will take ~2 minutes.
qiime feature-classifier classify-sklearn \
--i-reads ../dada2/seqs.qza \
--i-classifier 2024.09.backbone.v4.nb.qza \
--o-classification taxonomy_gg2.qza
Let's make our taxonomy into a visualization, transfer to our local computers, and look at it in QIIME2 View.
Let's take a look at our taxonomy file using view.qiime2.orgLinks to an external site.!-
We can see that we get an output file with each Feature ID, its taxonomy, and the confidence level.
-
A note about confidence intervals: Confidence values here are the raw probability estimates output by the naive Bayes classifier, i.e., the predicted probability that the predicted taxon is correct and not another taxon. Naive Bayes classifiers are good at classifying but poor at estimating probabilities, so the “confidence” scores should not be taken too seriously.... just a rough estimate of how confident the classifier feels about its own prediction! - Nicholas Bokulich
-
Helpful QIIME2 forum post on how confidence is calculated (hint: it isn’t simple):
We will now remove contaminating features like chloroplasts and mitochondria
-
Things we often want to remove are plant-derived DNA or eukaryotically-derived DNA, but you can remove other contaminates too here by adding that taxonomy to the --p-exclude line.
-
The reason these show up in our data is due to the endosymbiotic theory, that mitochondria & chloroplasts, likely originating as bacteria, became symbionts in cytoplasm of eukaryotic cells.
-
note that sp004296775 is another chloroplast, it MUST also be removed. see this forum post
Filter the table:
--p-exclude, Comma-separated list of taxonomy substring matches. Same logic as the grouped table filter above.
Taxonomy Barplots Without Contaminants
Now that we have ASVs classified taxonomically, let's generate a taxa barplot to visualize it, transfer it to our local computers, and look at it in QIIME2 View.
# Generate the taxa barplot
qiime taxa barplot \
--i-table ../dada2/table_nomitochloro.qza \
--i-taxonomy ../taxonomy/taxonomy_gg2.qza \
--m-metadata-file ../metadata/metadata.txt \
--o-visualization taxa_barplot_all_samples.qzv
You've just done your first taxonomic analysis, congratulations!
Open taxa_barplot_all_samples.qzv on view.qiime2.org
Questions:
1. Are there any Archaea in our samples? 2. Do our controls look like our real samples? 3. What is the most abundant phyla? 4. What is an abundant taxa that you see in the skin samples? 5. Do you see any differences in taxa between sample type? What about facility?
Pro tips/extra info:
1. If you ever want to train your own classifier, here is a link to the tutorial on the QIIME2 website. - and why would you want to do this? becuase some regions of the 16S gene don't have publically available pre-train classifiers for download, so you have to do it yourself.
2. Here is a link to some data resources for picking out pre-trained classifiers and reference databases
3. Instead of filtering your feature table, QIIME2 also allows you to filter your taxonomy.qza. Either way will work just fine.
4. To learn more about filtering data, visit the following filtering tutorial on the QIIME2 website
Outputs
| File | Type | Description |
|---|---|---|
taxonomy_gg2.qza |
Artifact | Taxonomic assignments for all ASVs |
taxonomy_gg2.qzv |
Visualization | Tabulated taxonomy with confidence scores |
table_controls.qza |
Artifact | Feature table with only the controls |
taxa_barplot_all_samples.qzv |
Visualization | Taxonomy barplot (all reads) |
table_nomitochloro.qza |
Artifact | Full table, contaminants removed |
taxa_barplot_controls.qzv |
Visualization | Taxonomy barplot (only controls) |
End of Day 1, Directory Structure
At the end of Day 1 your working directory should look like this:
Next: Quality Control