Quality Control
Lets Get Started!
Step 1: Check the controls for sequencing depth
Step 2: Check controls by visualizing the taxa bar plot with only the controls
Log into OnDemand, open a new terminal session, and activate the reservation.
sinteractive --reservation=microbiome --time=04:00:00 --partition=amilan --nodes=1 --ntasks=6 --qos=normal
Activate the QIIME2 Module
Make sure we are in our working directory
Before proceeding to diversity analyses, we inspect our sequencing controls to evaluate potential contamination, assess reagent blanks, and confirm our negative controls are not contaminated.
Filter to only keep control samples
qiime feature-table filter-samples \
--i-table table_nomitochloro.qza \
--m-metadata-file ../metadata/metadata.txt \
--p-where "[sample_type]='control'" \
--o-filtered-table table_nomitochloro_controlsOnly.qza
Summarize the Filtered Table
Get a per-sample read count summary of the table that has been filtered to just contain the controls:
qiime feature-table summarize \
--i-table table_nomitochloro_controlsOnly.qza \
--o-feature-frequencies feature-frequencies-nomictochloro_controlsOnly.qza \
--o-sample-frequencies sample-frequencies-nomitochloro_controlsOnly.qza \
--o-summary table_nomitochloro_controlsOnly.qzv
Check the controls for sequencing depth
-
positive controls contain a known set of microbes in known proportions, and should contain a reasonable amount of reads, it is reasonable your positive controls have a similar amount of reads as your real samples.
-
your negative controls should have VERY LOW reads (tens to hundreds). Your negative controls should not contain thousands or tens of thousands of reads. this may indicate contamination somewhere in the workflow.
Check controls for contamination by visualizing the taxa bar plot with the controls and soils
# First filter samples to keep controls, and soils so you can compare between the two.
qiime feature-table filter-samples \
--i-table ../dada2/table.qza \
--m-metadata-file ../metadata/metadata.txt \
--p-where "[sample_type]='control' OR [sample_type]='soil'" \
--o-filtered-table ../dada2/table_controls_soils.qza
Create a taxabarplot with our table with just controls and soils so they can compare.
qiime taxa barplot \
--i-table ../dada2/table_controls_soils.qza \
--i-taxonomy ../taxonomy/taxonomy_gg2.qza \
--m-metadata-file ../metadata/metadata.txt \
--o-visualization taxa_barplot_controls_soils.qzv
When you open taxa_barplot_controls.qzv, work through this checklist:
You can download an example file to see some positive controls from the google drive (day 2 qzv), it is the taxa_plot_cf_noMitoChloro_rare6k.qzv file
Why do we check controls?
-
Contamination (from the lab, other samples, kit contaminates, etc)
-
Workflow validation
Why include positive controls?
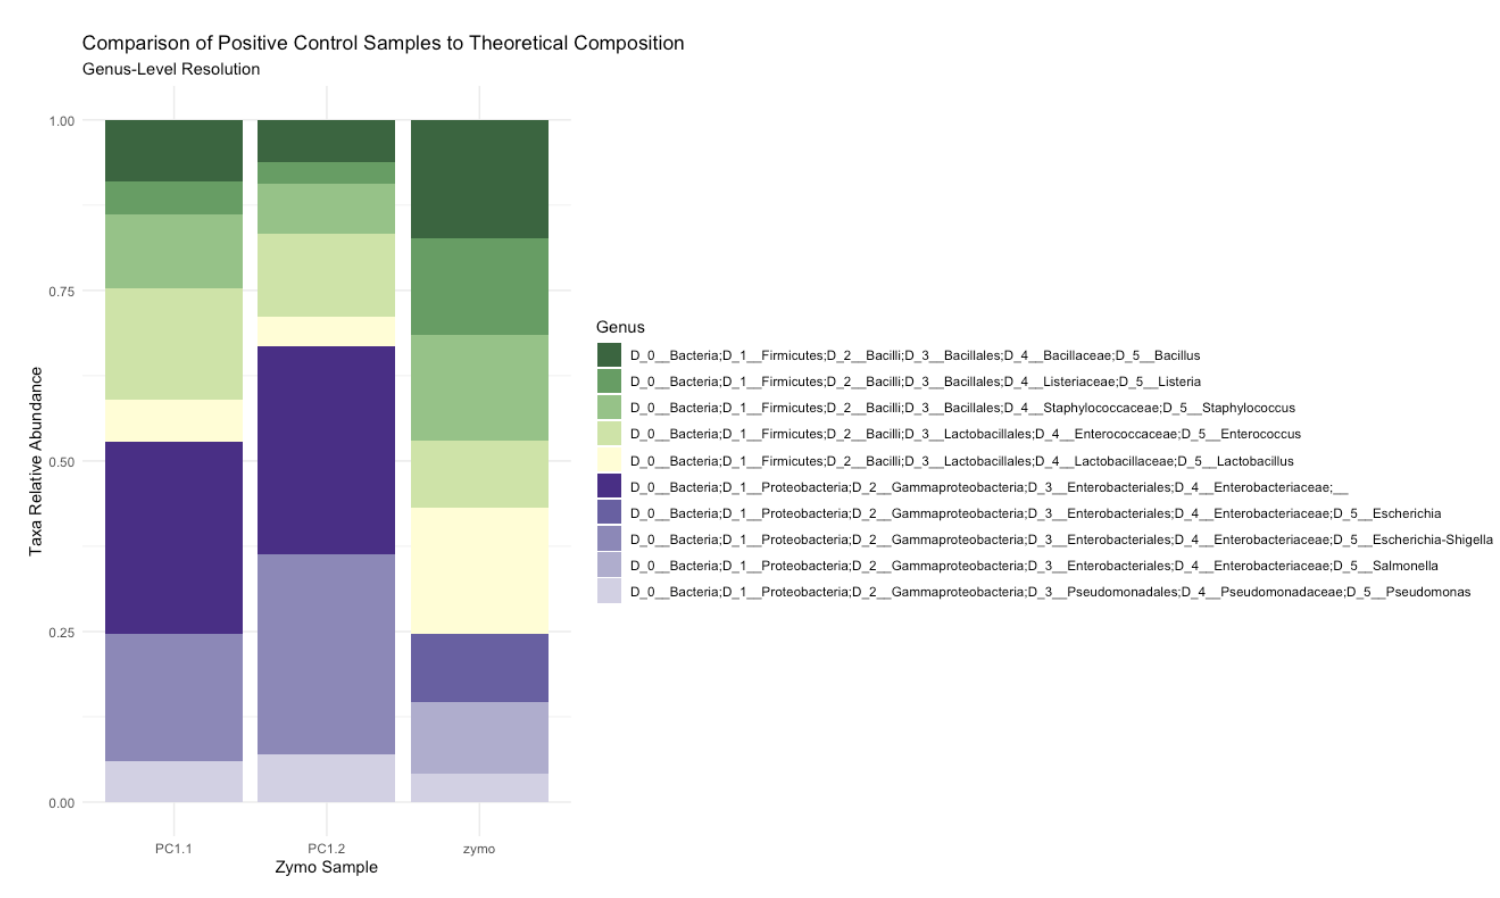
- Positive controls contain known combinations and quantities of microbiomes. This allows you to confirm whether your DNA extraction and library preparation protocol was successful and is suitable for identifying a variety of different organisms.
What should you do with taxa found in extraction controls?
-
Report them
-
Remove them statistically with tools designed for contamination removal (e.g Decontam, or Source tracking for Contamination Removal in microBiomes (SCRuB))
-
In most cases, researchers should avoid simplistic removals of taxa, OTUs, or ASVs appearing in negative controls, as many will be microbes from other samples rather than reagent contaminants.
Question What taxa did you notice in the extraction controls?
What does it look like when there is contamination?
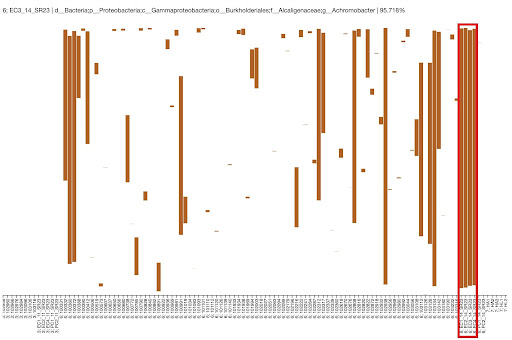
- in this example, there was kit contamination of Achromobacter from the DNA extraction kit. Achromobacter is the brown bar that is overwhemliming the negative extraction controls, and we also see it show up in the real samples too.
Outputs
| File | Type | Description |
|---|---|---|
table_nomitochloro.qzv |
Visualization | Per-sample read count summary |
table_controls.qza |
Artifact | Feature table filtered to controls only |
taxa_barplot_controls.qzv |
Visualization | Taxonomic composition of controls |
Next: Rarefaction