Machine Learning
QIIME2's sample-classifier plugin provides supervised machine learning tools for classification and regression using microbiome feature tables. Here we ask two questions:
First we used ANCOMBC2 to test for differential abundance and investigate whether individual ASVs or taxa were more or less abundant within different groups. Now, we will further our analysis by using a machine-learning classifier for predicting sample characteristics. This will help us determine how predictive the microbiome composition is of other characteristics about a sample.
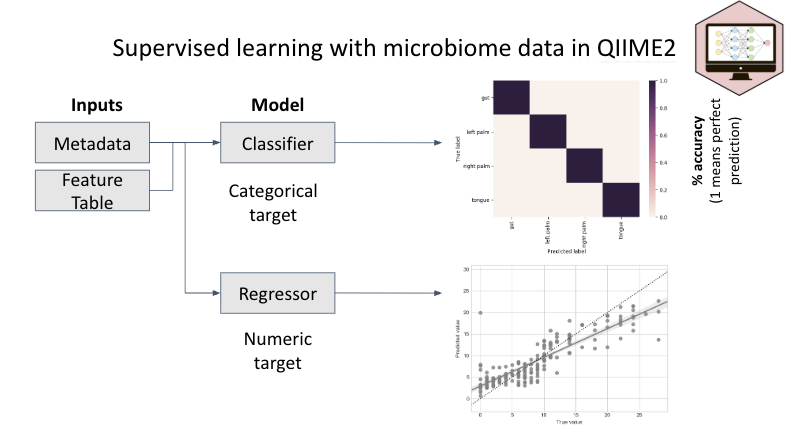
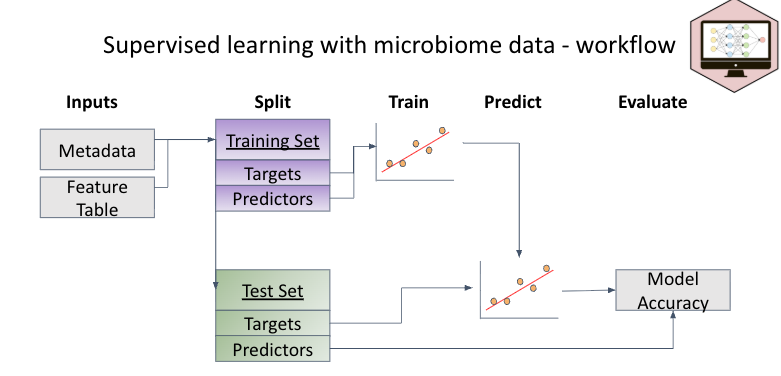
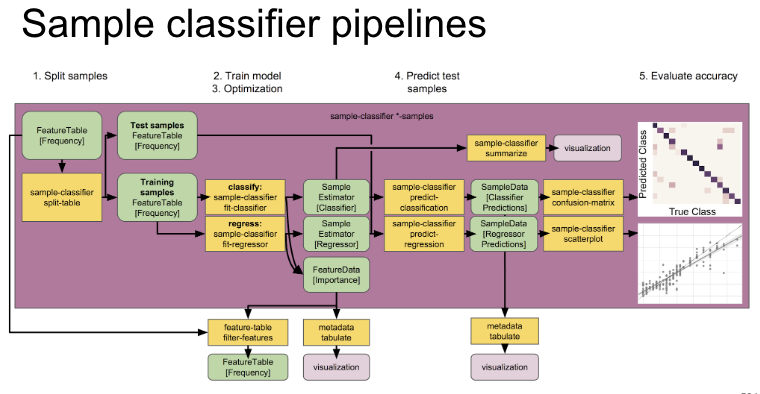
Basic steps within supervised learning for microbiome data
1. Split samples
- 80% train, 20% test
2. Train model
- Learn patterns from training set
3. Optimization
- CV to determine best parameters
4. Predict test samples
- Test model on the test set
5. Evaluate accuracy
6. Extract important features
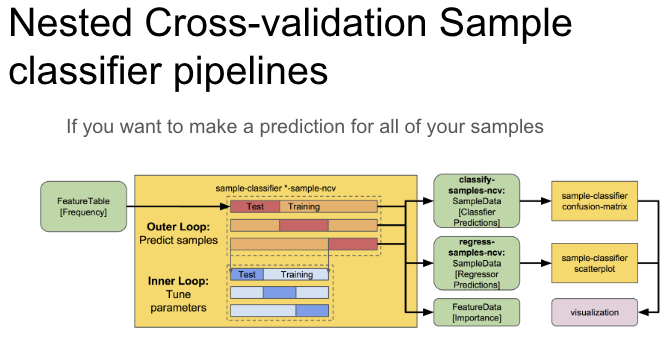
Best practices and notes of caution…
-
A minimum of approximately 50 samples should be provided.
-
Categorical metadata columns that are used as classifier targets should have a minimum of 10 samples per unique value.
-
Continuous metadata columns that are used as regressor targets should not contain many outliers or grossly uneven distributions.
-
Keep your testing data and testing data-related samples out of your training dataset. This is cheating and can cause unrealistically high accuracy. QIIME2 does not yet provide options for studies with repeated measures, so we are going to do it anyway for demonstration purposes.
-
If you have repeated measures you need to run machine learning outside of qiime2 so that you can account for donor in order to keep same-donor samples together and correctly split the training and test data.
ML Tutorial (classification and regression)
- Can we use the skin or soil microbiome to predict where a sample was collected? (classification)
- Can we use the skin or soil microbiome to predict how long a sample has been decomposing for? (regression)
Classification
Predict Facility
Can we use the skin or soil microbiome to predict where a sample was collected?
We start with the rarefied table and again collapse it to the level of interest (here is level 7- species).
First we need to make a machine learning directory and move into that directory.
# collapse rarefied table to level of interest
qiime taxa collapse \
--i-table ../ancombc2/table_nomitochloro_nocontrol_5000.qza \
--i-taxonomy ../taxonomy/taxonomy_gg2.qza \
--p-level 7 \
--o-collapsed-table rare_table_L7.qza
This will be done using a Random Forest classifier (https://towardsdatascience.com/random-forest-classification-and-its-implementation-d5d840dbead0 here is the link in case you need a reminder for how this works). As a review, remember that with machine learning we will be taking our feature table and splitting it into test sample and training samples. The Random Forest classifier will be trained using the train samples, and the accuracy of the trained classifier will be assessed by testing on the test samples. Because this is a classification, we will get a matrix as our output (as opposed to a scatterplot, which is what we would get if we were training a regressor to use with continuous data). This command will take a few minutes.
qiime sample-classifier classify-samples \
--i-table rare_table_L7.qza \
--m-metadata-file ../metadata/metadata.txt \
--m-metadata-column facility \
--p-random-state 123 \
--p-n-jobs 1 \
--output-dir sample_classifier_results_facility
Random State
Setting --p-random-state 123 makes the results reproducible. Any integer works, use the same value whenever you need to reproduce the exact same train/test split and model.
If you ever want to use something other than a Random Forest method, this can be changed using the "estimator" parameter. Here is a LinkLinks to an external site. to the plugin that shows the different classifiers you can use.
The line "--p-random-state 123" is something we haven't seen before. This number sets a seed to the random generator such that the train-test splitting of the data is reproducible. You don't need to know a lot of detail about this, but just know that it can be any random number, and if you want to get the exact same results when running the model a second time you should use the same number.
Visualize Top Features
Facility Classifier
Results
You now have a directory called "sample_classifier_results_facility" that has several different files. We have some qza files with our predictions, important features, probabilities, and sample estimations. There is more detail about these files in the full linked tutorial below.
For now, we are going to focus on the qzv files that were generated for us - accuracy_results.qzv, heatmap.qzv, and model_summary.qzv. Let's transfer these to our local computers.
Let's first look at accuracy_results.qzv. This is a confusion matrix (or error matrix) that tells us how accurate our predictions are. A perfect model would give a single diagonal line. Are there any errors in our model?
Accuracy Results
-
This is a confusion matrix (or error matrix) that tells us how accurate our predictions are
-
The ROC curves below the confusion matrix are a way to visualize the true and false prediction rates. The important thing to notice is that our model is better at predicting than if it were done by chance.
-
So the higher up the ROC curve is above the by-chance model, the better.
Model Summary QZV just prints your model parameters
Heatmap QZV
Next we can look at the heatmap.qzv. This gives us a visualization of the abundance of important features for each facility. Do any features stick out to you, and appear to be really different between facility?
Want to see more important features? Because our modeling gave us the important features (ASVs), we can make another heat map with the top 100 most important features to look and how their abundances change over categories.
Generate a heatmap showing normalized abundance of the 100 most important features:
qiime sample-classifier heatmap \
--i-table rare_table_L7.qza \
--i-importance sample_classifier_results_facility/feature_importance.qza \
--m-sample-metadata-file ../metadata/metadata.txt \
--m-sample-metadata-column facility \
--p-group-samples \
--p-feature-count 100 \
--o-heatmap sample_classifier_results_facility/heatmap_100_features.qzv \
--o-filtered-table sample_classifier_results_facility/filtered_table_100_features.qza
Regression
Predict Accumulated Degree Days
Can we use the skin or soil microbiome to predict how long a sample has been decomposing for?
Train a Random Forest regressor to predict the continuous variable add_0c (accumulated degree days):
qiime sample-classifier regress-samples \
--i-table rare_table_L7.qza \
--m-metadata-file ../metadata/metadata.txt \
--m-metadata-column add_0c \
--p-estimator RandomForestRegressor \
--p-n-estimators 20 \
--p-random-state 123 \
--output-dir sample_regressor_results_ADD
Accuracy results:
-
Regression showing the real ADD vs model predicted ADD (y-axis)
-
R2 and p-values shows good fit
-
Mean squared error (MSE): lower = better
-
Square root of MSE 3096 = Mean absolute error 55.64 ADD (~ 2.8 days)
HOWEVER:
Samples from same donor were split between training and testing data (cheating)
Inspect Feature Importances
ADD Regressor
Which features are the most important?
qiime metadata tabulate \
--m-input-file sample_regressor_results_ADD/feature_importance.qza \
--o-visualization sample_regressor_results_ADD/feature_importance.qzv
Notes on ML:
If you'd like more practice using machine learning for sample classification in QIIME2, here is a whole other tutorial (with a lot more detail) for you to have fun with! https://docs.qiime2.org/2021.11/tutorials/sample-classifier/
There are a couple of caveats to using QIIME2 for your machine learning. Cross-validation methods aren't very flexible (e.g., you can't group by subject or some other metadata category - it can only randomly split samples into your training and testing data sets). You also cannot use extra metadata as predictive features (e.g., if there was some sort of predictive metadata category, like temperature or pH, there is no way in QIIME2 to incorporate this as a feature into your model along with ASVs). If these are things that are important to your analyses, then learning how to do machine learning in Python or R is the way to go.
Outputs
| File | Type | Description |
|---|---|---|
sample_classifier_results_facility/ |
Directory | Classifier results (accuracy, confusion matrix, feature importance) |
sample_classifier_results_facility/heatmap_100_features.qzv |
Visualization | Heatmap of top 100 features |
sample_classifier_results_facility/filtered_table_100_features.qza |
Artifact | Feature table subset to top 100 features |
sample_regressor_results_ADD/ |
Directory | Regressor results (R², scatter plot, feature importance) |
sample_regressor_results_ADD/feature_importance.qzv |
Visualization | Tabulated feature importances for ADD |
Next: Network Primer